Exploring Nonparametric Techniques: Mann-Whitney U and Kolmogorov-Smirnov Tests
110 likes | 134 Vues
Learn about nonparametric tests like the Mann-Whitney U and Kolmogorov-Smirnov for data analysis. Dive into their limitations and advantages compared to parametric tests, and understand how to apply them effectively in research.

Exploring Nonparametric Techniques: Mann-Whitney U and Kolmogorov-Smirnov Tests
E N D
Presentation Transcript
University of Warwick, Department of Sociology, 2012/13SO 201: SSAASS (Surveys and Statistics) (Richard Lampard)Analysing Means II: Nonparametric techniques(Week 15)
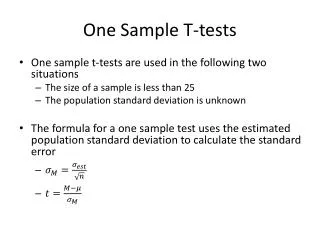
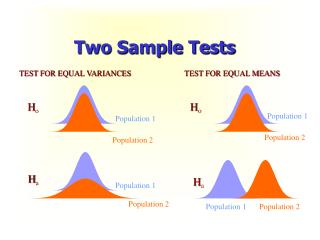
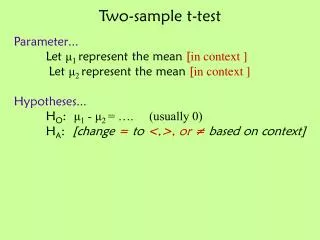
Two-sample t-tests: Limitations • Two-sample t-tests are used to test the (null) hypothesis that the population means for two groups are the same. • But t-tests make an assumption of homogeneity of variance (i.e. that the spread of values is the same in each of the groups). • Furthermore, the assumption that the difference between sample means has a t-distribution is only reasonable for small samples if the variable has (approximately) a normal distribution.
Nonparametric alternatives • Where the assumptions of a t-test are seriously violated, an alternative approach is to use a nonparametric test. • Nonparametric tests are also referred to as distribution-free tests, as they have the advantage of not requiring the same assumptions about distributions of values. • In practice (when using SPSS), such tests work in a similar way to parametric tests, with the same processes of selecting variables and of assessing statistical significance, based on the p-value that is calculated for the test statistic.
The weakness of the nonparametric alternative… • However, parametric tests such as t-tests are to be preferred because, in general, for the same sample size(s), they are less likely to generate Type II errors (i.e. the acceptance of an incorrect null hypothesis). • Nonparametric tests are thus less powerful. • This lack of power results from the loss of information when interval-level data are converted to ranked data (i.e. merely ordering the values from lowest to highest).
The Mann-Whitney U-test • This is a nonparametric alternative to the two-sample t-test for comparing two independent samples. In effect, it focuses on average ranks of values rather than on average values. • U is calculated by, first, ranking all the values in the two samples taken together. • The ranked values for each sample are then added up, and, if the sample size for a sample is n, then n(n+1)/2 is subtracted from the sum of the ranks. • The smaller of the numbers generated for the two samples becomes the U-statistic.
Mann-Whitney (continued) • The U-test can represent a better way of comparing an ordinal measure between two groups than assuming the measure can be treated as interval-level. • Since it is based on ranks, it is more robust than the t-test with respect to the impact of outliers. • However, it is less appropriate where there are more than a small number of ‘tied’ values.
Another alternative… • Where there are a substantial number of tied values, the Kolmogorov-Smirnov Two Sample Test may be more appropriate. • This is (yet) another nonparametric test, focusing on whether the two groups have the same distribution of values, and based on the maximum absolute difference between the observed cumulative frequency distributions for the two samples • However, this is a broader hypothesis than one focusing on the level of the values. • It has also been noted in the technical literature that this test has limited power and hence gives a high chance of a Type II Error, i.e. not identifying a difference when one exists.
…and the nonparametric alternative where there are more than two means? • The Kruskal-Wallis H Test is the nonparametric test equivalent to (one-way) ANOVA, being an extension of the Mann-Whitney U-test to allow the comparison of more than two (independent) samples.
An example Sample of graduates 1 = Strongly agree to 5 = Strongly disagree
Is there a gender difference? • Means: Men = 2.60 ; Women = 2.86 • Two-sample t-test: t = -2.585 (482 d.f.); p = 0.010 • Mann-Whitney U test: z = -2.407; p = 0.016 • Kolmogorov-Smirnov two-sample test p = 0.139
Are there regional differences? Government office region 2003 version Mean N Std. Deviation North East 3.06 9 0.879 North West 2.54 48 1.164 Yorkshire and Humberside 3.14 40 1.249 East Midlands 2.75 28 1.257 West Midlands 2.40 31 0.942 SW 2.89 35 1.205 Eastern 2.55 57 1.096 Inner London 3.14 27 1.116 Outer London 2.44 30 0.925 South East 2.65 105 1.045 Wales 3.00 19 1.345 Scotland 2.80 55 1.091 Total 2.73 484 1.123 One-way ANOVA: F = 1.825 (11 & 471 d.f.); p = 0.048 Kruskal-Wallis H-test: Chi-square = 17.66 (11 d.f.); p = 0.090