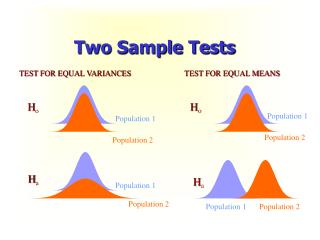
Two sample tests
Two sample tests. Study designs. Single sample, compare two sub-samples (cross-sectional survey) Compare samples from 2 different populations (2 cross sectional surveys, case-control study) Single sample; subjects randomly allocated to different interventions (experiment, clinical trial).

Two sample tests
E N D
Presentation Transcript
Study designs • Single sample, compare two sub-samples (cross-sectional survey) • Compare samples from 2 different populations (2 cross sectional surveys, case-control study) • Single sample; subjects randomly allocated to different interventions (experiment, clinical trial)
Simple randomization • Generate n uniform (0,1) random deviates. • If ui<0.5 assign to intervention A to unit i; • if ui> 0.5 assign B. • 3. Note nA is a random variable with E(nA)=0.5.
Restricted randomization • Generate a U(0,1) deviate, ui, for each • unit in the sample. • 2. Sort the deviates from smallest to largest. • 3. Assign intervention A to the units with • the n/2 smallest ui’s. • 4. Note this results in half of the sample • assigned to each intervention;i.e. nA is fixed.
Example: An experiment was conducted to see if a drug could prevent premature birth. 30 women at risk of premature birth were assigned to take the drug or a placebo (15 in each group). Outcome: birthweight.
A study was done to compare the percent body fat of 3rd graders At schools on 2 Native American Reservations: Gila River (Tohona O’odham) and White River (Apache).