Download
1 / 20
200 likes | 353 Vues
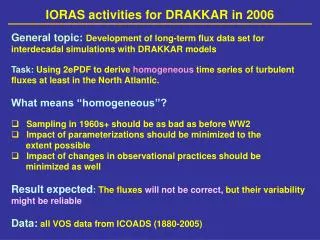
IORAS activities for DRAKKAR in 2006. General topic: Development of long-term flux data set for interdecadal simulations with DRAKKAR models Task: Using 2ePDF to derive homogeneous time series of turbulent fluxes at least in the North Atlantic. What means “homogeneous”?

E N D
IORAS activities for DRAKKAR in 2006 • General topic:Development of long-term flux data set for interdecadal simulations with DRAKKAR models • Task: Using 2ePDF to derive homogeneous time series of turbulent fluxes at least in the North Atlantic. • What means “homogeneous”? • Sampling in 1960s+ should be as bad as before WW2 • Impact of parameterizations should be minimized to the extent possible • Impact of changes in observational practices should be minimized as well • Result expected: The fluxeswill not be correct, but their variabilitymight be reliable • Data: all VOS data from ICOADS (1880-2005)
Homogenization of sampling in space: 6-hourly NWP individual variables Random sampling error Bulk parameteri-zations Random VOS-like sub-sampling Real-time VOS-like sub-sampling Total sampling error Objective analysis error Re-computation of surface fluxes using bulk formulae
Sampling errors in fluxes: Double exponential distribution (2ePDF) ×10-3
Homogenization of sampling in time: per 5°x5° box MC-sub-sampling for n=7,15,25,50 per 5°x5°, 2°x2° box
Parameterizations: • COARE-3.0 (no skin, no free convection, instead - 4/3 convection scheme for calm winds, no mature turbulence scheme) Parameters: • Wind – Beaufort only, WMO1100 => to Lindau (1995) scale • SST – buckets only, no engine intakes • Air temperature – all Production – iterative run for every month: • 1st guess - 2eWPDF derivation of monthly means for 10-degree boxes south of 40N and for gerrymander network north of 40N • 2ePDF computation for 5x5 degree boxes, if the PDF does not fit at 95% level, use the 1st guess for the thresholds on the parameters • then – repeat the procedure again
Climatological differences between 2ePDF-derived and traditionally averaged fluxes
Regional time series of winter sensible + latent heat flux 3 1 2 4
95% sign. lev. Link of the leading mode in turbulent fluxes with NAO index: 30-yr running correlation changes over time considerably
NAO-related τ, Q, E-P Control NAO-related heat flux only NAO-based NAO is a dominant signal in driving NA circulation? NAO-based reconstructions of forcing are possible Eden and Willebrand 2001, Eden and Jung 2001 Reconstruction for 1865-1997: MHT, 48N Eden and Jung 2001, J. Climate Eden and Willebrand 2001, J. Climate HEAT FORCING IS IMPORTANT
Canonical correlation of the heat fluxes with HADSLP for different periods
Conclusions: 5-degree 123-yr homogeneous time series of turbulent fluxes (1880-2002) were derived using 2ePDF integration – multi-decadal variability is visible Product is available at 2-degree resolution for 1910-1940 and 1948-2005 Individual variables are also available, so that use of forcing based on bulk formulae is possible During the period 1915/20 – 1950/55 winter surface turbulent fluxes are just loosely connected with NAO, being closely related to NAO during the decades before and after this period Potential application Forcing long-term runs of ocean GCMs in [still] coarse resolution
Other activities: validation of NOAA blended satellite winds 11 satellites, 0.25x0.25 resolution, global, 1987-onwards, 6-hourly – effectively from 1994 Zhang et al. 2006
Validation of NOAA blended satellite winds 06:00 Much more detailed structure than ERA40 More reliable tropical winds than in both NCEP and ERA40 Good representation of coastal patterns 18:00
Computation of humidity: Strategy: • Statistical multiregression approach (not a neural network yet) for the decade of 1960s • Deviations from seasonal climatology are considered • Exponential functions + polynomials for Ta, V, SLP • Done locally, for every month and every box
Effect in latent heat flux estimates: RMS = 7 W/m2 Slope = 0.996 Intercept = + 1.4 W/m2
Precipitation from NWP: Threshold on small precipitation, associated with the spin-up effect: 0.02 – 0.1 mm/day – up to 10-12 mm/month in subpolar latitudes CMORPH – 0.25x0.25, daily, satellites + model, 2001-onwards
Winds Cardone (Oceanweather Inc.) kinematically corrected winds, up to 0.2 degree, 3-hourly (wind workstation)