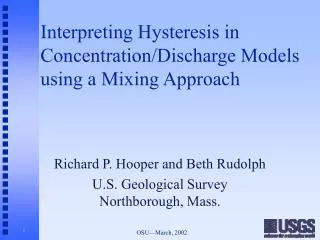
Using isotopes to identify source waters: mixing models
290 likes | 333 Vues
Learn how isotopes can identify source waters and solve groundwater recharge dilemmas. Gain insight into the practical applications of 2-component mixing models for analyzing water sources. Discover the methodology behind hydrograph separation using isotopic tracers in complex water systems. Explore case studies and real-world scenarios to master the art of isotopic analysis.

Using isotopes to identify source waters: mixing models
E N D
Presentation Transcript
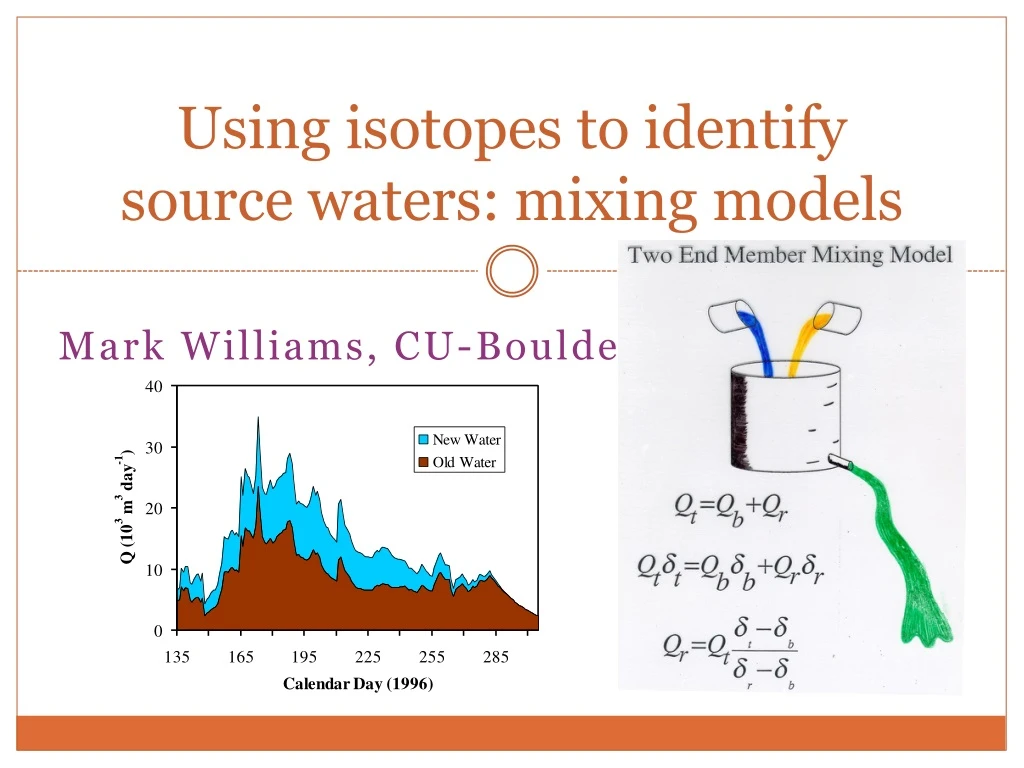
Using isotopes to identify source waters: mixing models Mark Williams, CU-Boulder
MWL (18O-D) graph can tell us: Sources of groundwater recharge: Average annual precipitation Summer rain Winter rain/snow Very old water, eg “Pleistocene age” Recharge flowpaths Piston flow Exponential flow
Problem: Regional groundwater vs South Platte river water as recharge to wells New well users near the South Platte River do not have water rights to Colorado River water Sued because downstream water users with senior water rights say that the wells are pumping their water What can the state engineer do? What can a consultant do for their client (on either side of the debate) Isotopes to the rescue!
2-component mixing models We can go from these simple examples to a general equation that works for almost all systems We assume our “sample” (well-water, streamflow, etc) is a mixture of two sources We can “unmix” the sample to calculate the contribution of each source Either as a mass of water or percentage
2 Component hydrograph separation Source 1 (River water) ? % Well Source 2 (Groundwater) ? % Tracer = d18O
River water Well 1 X Groundwater Well 2 Mixing line that connects the two end-members: a) sample must plot between the two end-members b) sample must plot on or near the mixing line.
MIXING MODEL: 2 COMPONENTS • One Conservative Tracer • Mass Balance Equations for Water and Tracer
-10‰ -15‰ River water -20‰ Well Groundwater Let’s put in some actual tracer concentrations.
Calculate the fraction contribution of groundwater and river water to our well Groundwater (g); River water (r), Well (w) Percent river water contribution to the well is: Cw – Cg/ Cr – Cg Sampling only for the tracer concentration (c) allows us to calculate the fraction contribution of each end-member to our mixture We need only three samples! No water flow measurements
2-component mixing model: calculation • Cw – Cg • Cr – Cg = percent contribution of river water • -15 – (-20) = +5 • -10 – (-20) = +10 = 50%
2-component mixing model: assumptions Only 2 components in mixture (groundwater well in this example) Mixing is complete Tracer signal is distinct for each component No evaporation or exchange with the atmosphere Concentrations of the tracer are constant over time or changes are known
Case Study:Hydrograph separation in a seasonally snow-covered catchment Liu et al., 2004
2 Component hydrograph separation “New” Water (Snowmelt) ? % Streamflow “Old” Water (Groundwater) ? % Tracer = d18O
Temporal Hydrograph Separation Solve two simultaneous mass-balance equations for Qold and Qnew 1. Qstream = Qold + Qnew 2. CstreamQstream =ColdQold+CnewQnew Yields the proportion of “old” or “new” water for each time step in our hydrograph for which we have tracer values
GL4 Dataset Soil Water Stream Water Snowmelt
Hydrograph fractions Data Event formula (new water) (D10-B10)/(D10-C10) Pre-event formula (old water) (B10-C10)/(D10-C10)
Fractionation in Percolating Meltwater d18O = -20‰ Snow surface Ground Difference between maximum 18O values and Minimum 18O values about 4 ‰ d18O = -22‰
VARIATION OF d18O IN SNOWMELT • d18O gets enriched by 4%o in snowmelt from beginning to the end of snowmelt at a lysimeter; • Snowmelt regime controls temporal variation of d18O in snowmelt due to isotopic fractionation b/w snow and ice; • Given f is total fraction of snow that have melted in a snowpack, d18O values are highly correlated with f (R2 = 0.9, n = 15, p < 0.001); • Snowmelt regime is different at a point from a real catchment; • So, we developed a Monte Carlo procedure to stretch the dates of d18O in snowmelt measured at a point to a catchment scale using the streamflow d18O values.
Summary/Review Isotopes can quantify the contribution of different source waters to wells, etc. 2-component separation assumes that the sample lies on a line between 2 end-members Assumptions in hydrograph separations Not always met Can extend to 3 or more end-members Simple diagnostic tool that should be consider as one of your first field measurements