Basic Course Experiments to Demonstrate Intercomparisons
This course provides a series of experiments to demonstrate intercomparisons, including statistical evaluation of data and teaching material for subsequent tutorials.

Basic Course Experiments to Demonstrate Intercomparisons
E N D
Presentation Transcript
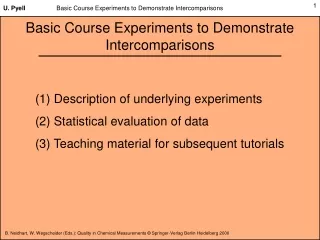
U. Pyell Basic Course Experiments to Demonstrate Intercomparisons Basic Course Experiments to Demonstrate Intercomparisons (1) Description of underlying experiments (2) Statistical evaluation of data (3) Teaching material for subsequent tutorials
U. Pyell Basic Course Experiments to Demonstrate Intercomparisons Experimental • volumetric method: titration of aliquots (25 mL) of an aqueous solution of NaOH (c 0.01 mol L-1) with a standard solution of H2SO4 (c1 = 0.1 mol L-1,c2 = 0.0100 mol L-1) employing a manual 50 mL-burette • each student analyzes aliquots of the same solution • each student repeats the titration three times with each standard solution six titrations per student • the results are handed out to supervisors via tables containing the consumed volume of standard solution
U. Pyell Basic Course Experiments to Demonstrate Intercomparisons Gaussian normaldistribution? 30 N 25 20 15 10 5 0 V/(10-2 mL) 25 26 27 28 29 30 31 32 33 34 35 35 37 38 39 Statistical Data Evaluation: Formation of Classes set of 54 experiments histogram
U. Pyell Basic Course Experiments to Demonstrate Intercomparisons 60 N 50 40 30 20 10 0 V/10-2 mL 25 26 27 28 29 30 31 32 33 34 35 35 37 38 39 Statistical Data Evaluation: the Probability Function cumulative frequency
U. Pyell Basic Course Experiments to Demonstrate Intercomparisons 1 P(x) 0 x 25 26 27 28 29 30 31 32 33 34 35 35 37 38 39 Statistical Data Evaluation: the Probability Function normalized cumulative frequency
U. Pyell Basic Course Experiments to Demonstrate Intercomparisons • special graph paper: normal probability paper • straight line normal distribution 99,999 P(V) 99,5 95 70 40 10 1 28 30 32 34 36 V/mL Normal Probability Plot
U. Pyell Basic Course Experiments to Demonstrate Intercomparisons Probability = (z, , ) Density of probability = (x, , ) Distribution function Probability Equation: Mathematical Description
U. Pyell Basic Course Experiments to Demonstrate Intercomparisons The Gaussian Distribution Function two parameters: = maximum = spread In most cases repeated measurements of a single quantity are normally distributed (after elimination of outliers).
U. Pyell Basic Course Experiments to Demonstrate Intercomparisons Calculation of Estimates from Experimental Data arithmetic mean = estimate of = sum of all measurements; n = number of measurements standard deviation s = estimate of relative standard deviation (RSD) = (s/ ) 100
U. Pyell Basic Course Experiments to Demonstrate Intercomparisons Influence of Experimental Parameters on Standard Deviation (manual 50 mL-burette)Concentration of standard solution: c1 = 0.1 mol L-1 c2 = 0.0100 mol L-1 3.21 mL 25.71 mL s 0.118 mL 0.249 mL RSD 3.67 % 0.97% N 54 54 The RSD is a measure of the precision of a method.The precision of a method can be improved by variation of experimental parameters.
U. Pyell Basic Course Experiments to Demonstrate Intercomparisons Improving Precision by Repeated Measurements 18 students, each student performed three titrations (N=54) arithmetic mean of three results c 0.1 mol L-1 0.0100 mol L-1 3.22 mL 25.70 mL s 0.118 mL 0.249 mL RSD 3.66 %0.97% 3.22 mL 25.70 mL sM 0.0862 mL 0.215 mL RSDM2.68 %0.84% The RSD is a measure of the precision of a method. The precision of a method can be improved by forming the arithmetic mean of the results of repeated measurements.
U. Pyell Basic Course Experiments to Demonstrate Intercomparisons Standard Deviation of the Mean mean of a sample of measurements estimate of the true value in case of no systematic deviation: = quantity to be measured standard error of the mean = standard deviation of the mean sM
U. Pyell Basic Course Experiments to Demonstrate Intercomparisons Normal Distribution with Different Spread
U. Pyell Basic Course Experiments to Demonstrate Intercomparisons Analyzing the Measurement Uncertainty (1) random deviation:volume uncertainty volumetric flask, volume uncertainty burette, reading uncertainty volumetric flask, reading uncertainty burette (dominating when using not-appropriate standard solution), individual uncertainties (2) systematic deviation:i.e. uncertainty of concentration of standard solution, cannot be reduced by forming the arithmetic mean of the results of repeated measurements
U. Pyell Basic Course Experiments to Demonstrate Intercomparisons Definition: Precision Precision = closeness of agreement between independent test results obtained under stipulated conditions (ISO 3534-1, 1993) • high precision low standard deviation • low precision large standard deviation • estimate of theprecisiondoes not consider the deviation of the arithmetic mean of a series of results from the true value • precision can be estimated if the true value is not known
U. Pyell Basic Course Experiments to Demonstrate Intercomparisons Definition: Accuracy Accuracy = closeness of agreement between the result of a measurement and the true value of the measurand (International vocabulary .....,1984) • accuracy is not only given by the spread of a normal distribution, but also by the deviation of the arithmetic mean of a series of results from the true value • accuracy can only be determined if the true value is known
U. Pyell Basic Course Experiments to Demonstrate Intercomparisons Confidence Limits of the Mean confidence interval = range within, with given probability, the true value lies confidence limits = extreme values of the confidence range t is a factor that depends both on the degree of confidence required and the degrees of freedom (n - 1) The confidence limit is a measure of the precision of a result. The precision of a result can be improved by repeated analysis.
U. Pyell Basic Course Experiments to Demonstrate Intercomparisons Confidence Limits of the Mean
U. Pyell Basic Course Experiments to Demonstrate Intercomparisons Presentation of Analytical Results (1) Possibilities of presentation (1) as estimate of the quantity measured, s as estimate of the precision (2) as estimate of the quantity measured, 95% confidence limit as estimate of the precision of the measurement No quantitative experimental value is of any value unless it is accompanied by an estimate of the uncertainty involved in its measurement. no universal convention the form used has to be stated, n has to be given
U. Pyell Basic Course Experiments to Demonstrate Intercomparisons Presentation of Analytical Results (2) The number of significant figures given indicates the precision of a value. significant figures: all digits which are certain plus the first uncertain one In our case result of titration: c(NaOH) = 0.00972 mol L-1 (0.000010 mol L-1) n = 54 number of measurements arithmetic meanthree significant figures standard deviation
U. Pyell Basic Course Experiments to Demonstrate Intercomparisons Summary Learning objectives • statistical deviation systematic deviation • Gaussian normal distribution, statistical evaluation of data • improving the precision of a method • presentation of data