Download

1 / 5
50 likes | 190 Vues
This comprehensive lesson plan integrates mathematics and technology through an engaging lemonade business project. Designed for seventh and eighth graders, students will collect data and utilize Excel to create spreadsheets, perform calculations, and visualize their findings using graphs and charts. Through this hands-on experience, students will learn to organize and display data effectively, make predictions, and draw conclusions based on their analyses. This plan aligns with mathematics standards E.8.1, E.8.2, and E.8.4, allowing learners to develop crucial data interpretation skills.

E N D
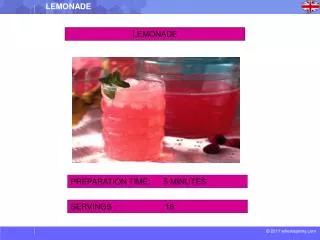
EXCEL-lent Lemonade Math/Technology Lesson Plan Laura Erke Lakewood School Grade 7 and 8
Mathematics Standards • E.8.1 Work with data in the context of real-world situations by: • using technology to generate displays, summary statistics*, and presentations • E.8.2 Organize and display data from statistical investigations using: • appropriate tables, graphs, and/or charts (e.g., circle, bar or line for multiple sets of data) • E.8.4 Use the results of data analysis to: • make predictions • develop convincing arguments • Draw conclusions
Technology Standards • A.8.1 Use common media and technology terminology and equipment • construct a simple spreadsheet, enter data, and interpret the information • incorporate database and spreadsheet information (e.g., charts, graphs, lists)in word-processed documents • plot and use different types of charts and graphs (e.g., line, bar, stacked, scatter diagram, area, pie charts, pictogram) from a spreadsheet program.
Objectives • Students will collect data and use the data to create a basic spreadsheet in Excel. • Students will use Excel to perform mathematical functions. • Students will use Excel to interpret data through graphs. • Students will summarize their findings and draw conclusions.
Lesson Procedures • Introduction/Explore • http://www.coolmath-games.com/lemonade/index.html • Data Collection • Spreadsheet Basics • Data Analysis/Functions and charting • Reports