HFMA Website
HFMA Website. Practical Information for Your Revenue Cycle. Objectives. Discover HFMA Website’s Information Demonstrate Practical Application of the information Challenge - Do!. Discover Site Layout. The Site Layout Includes the following: Knowledge Center * Education & Events *

HFMA Website
E N D
Presentation Transcript
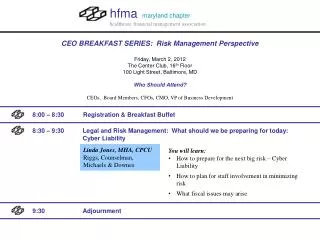
HFMA Website Practical Information for Your Revenue Cycle
Objectives • Discover HFMA Website’s Information • Demonstrate Practical Application of the information • Challenge - Do!
DiscoverSite Layout • The Site Layout Includes the following: • Knowledge Center * • Education & Events * • Publications * • HFMA Initiatives &* • Career Center * • New & Opinion * • Marketplace * • Communities * • About HFMA
Discover Knowledge Center • The Knowledge Center has a plethora of information in the following categories: • Accounting and Financial Reporting • Finance and Business Strategy • Legal and Regulatory Compliance • Operations Management • Payment, Reimbursement, and Managed Care * • Revenue Cycle * • Technology *
Discover • There are areas that relate to Revenue Cycle in Knowledge Center, but the the HOT ones are: • Legal and Regulatory Compliance • Payment, Reimbursement, and Managed Care • Technology
Discover • The Area of Greatest Interest for Revenue Cycle Leaders? The Revenue Cycle Category!!!
Discover – Knowledge Center Revenue Cycle * • Bad Debt • Billings and Collections • Charity Care and Financial Counseling • CDM, Charge Capture and Coding • Consumer-Directed Health Care • Denials Management • Patient Access • Self-Payment Collection
Discover Education &Events • Key pieces to this part of the site: • There are virtual conference trainings that are free. • Certification information is available • Credentialing for your Revenue Cycle Staff is available • Training Products (Mastering Customer Service and Revenue Cycle)
Discover Publications • HFM Magazine * • Healthcare Cost Containment Newsletter • Revenue Cycle Strategist Newsletter * • Strategic Financial Planning Newsletter • Leadership • Healthcare Finance Strategies E-Bulletin • Career Opportunities E-Bulletin • Patient Friendly Billing E-Bulletin • Business of Caring Archives
DiscoverHFMA Initiatives • HFMA’s MAP * • The Value Project • Principles and Practices Board • Healthcare Reform • Patient Friendly Billing * • Healthcare Financial Pulse • Research and Trends • Financing the Future • Coalitions
DiscoverCareer Center • Job Bank * • Careers at HFMA • Certification • Subscribe to Career Opportunities
DiscoverNews & Opinion • It has Healthcare Finance News • From the Chair and President • HFMA News • My favorite is the News Roundup (News from various sources talking about things that can impact Revenue Cycle)
Discovering Communities • Revenue Cycle Forum * • More Article Access • More Tool Access • Ask Experts Questions • Participate in List Serve and Message Board
Demonstrate?!?! • Your Revenue Cycle is a Mess • You can’t fix it RESISTANCE IS FUTILE!!!
MAP KeysFirst Set • Net Days in A/R • Aged A/R as a Percentage of billed A/R • Point-of-Service Collections • Cost to Collect • Cash Collections as a Percentage of Adjusted Patient Net Service Revenue • Bad Debt • Charity Care • Days in Total Discharged Not Final Billed (DNFB)
MAP Keys 2nd Set • Aged A/R as a % of Billed A/R by Payer Group • Day in Final Billed Not Submitted to Payer • Days in Total Discharged Not Submitted to Payer • Late Charges as % of Total Charges • Initial Denial Rate – Zero Pay • Initial Denial Rate – Partial Pay
MAP Keys2nd Set • Denial Overturned by Appeal • Net Days Revenue in Credit Balance • Pre-Registration Rate • Insurance Verification Rate • Service Authorization Rate
MAP Keys • Effective 12/01/10 MAP Application was made available. • Cost is based on size • Solo Facility • System • Not Necessary to Participate in MAP Award • MAP Keys bring standard definitions and purpose to enable providers to compare with like facilities
MAP Keys • New KPI’s • Days in Final Billed Not Submitted to Payer (FBNS) tracks claims held by edits in claims processing system or secondary bills not sent out • Days in Total Discharged Not Submitted to Payer (DNSP) – Includes FBNS and DNFB
DemonstrateHFMA Usefulness • Ecclesiastes 1:9 NIV “What has been will be again, what has been done will be done again; there is nothing new under the sun.” Jason’s Translation: Don’t recreate the wheel…Steal !!!
Demonstrate KPI’s – Patient Access • Average Registration Time – unknown, but patient’s are complaining • Average Patient Wait Time – unknown. But patients and departments complaining • Average patient registrations per shift – Unknown • Registration Data Quality – Unknown but a lot of patient and business office complaints • MSPQs obtained – Accidentally eliminated
Demonstrate Using KPI’s Access/Registration • Average registration interview duration < 10 minutes • Average patient Wait time < 10 Minutes • Average Registrations per shift (Varies by department and system - 35 inpatient 40 outpatient is Hammer’s KPI) • Data Quality 99% or better • ABN and MSPQ when Required 100%
DemonstrateWait time KPI’s • Requested Productivity Reports with Detailed Registration Start and Stop Times • The times seemed reasonable 80% of the time • 20% of the time there were significant waits • Worked with Staff and found that Incomplete Orders shut the process down • Designated an office individual to handle those situations with patient, physician and department • Increased percentage to 98%
DemonstrateWait Time KPI’s • Still had complaints • Volume of Accounts didn’t work due to rush periods and lulls after doing a traffic study. It wasn’t a productivity issue • Implemented a inexpensive check-in system • Patients were waiting a long time for lab services and surgical services • Implemented direct lab registration process • Implemented Quick-Registration for Surgical Patients • Significant improvement (except for lab patients at peak times) • Patient Access Perception Improved (Press Ganey)
DemonstrateData Quality • Complaints from Patient and Business Office • Implemented Individual Auditing • Scanned Cards and IDs for Identity Protection and to Audit Accuracy
DemonstrateDate Quality Expect Staff to “Bomb” the first audits. They need to fully understand expectations.
Demonstrate Data Quality Scores will improve over time as staff see that quality is being monitored seriously
DemonstrateCompliance • If you don’t ask the question, you don’t know what is going on. • MSPQ’s were accidentally discontinued when an eligibility verification was implemented a year before. • Training occurred and the MSPQ was initiated immediately following.
Demonstrate KPI - HIM • Hospital Scenario • Cash flow diminishing • HIM days at 10 • Coder productivity unknown • Un-coded charts > 30 unknown
DemonstrateUsing KPI’s HIM • All coding done is in descending balance order, not first in/first out. • Consistently monitor and control Discharged-Not-Final-Billed A/R due to HIM. • HIM “DRG development” D-N-F-B A/R days greater than the late charge hold ≤ 2 A/R days • Inpatient charts coded, per coder per day • 23 - 26 • Outpatient charts coded, per coder per day • 150 - 230 • Emergency room charts coded, per coder per day • 190 - 250 • All coding is done by employees who report to the HIM director.
DemonstrateUsing HIM KPI’s • Discovered that completed coding was being tracked by a paper report generated weekly. • Employee manually noted issues on paper. • High Balances were worked like low balances (No Pareto Principle gains) • Discovered a software add-on not used by hospital and created queues for each coder • Productivity Reports created • Coding Days began to drop except for outpatient
DemonstrateUsing HIM KPI’s • Discovered that Facility-Based Urgent Care coding happened on-site • Coder position was vacant and lead was coding when had time • Coding was 6 months behind • Used Scanning Technology to scan charts at site daily • Urgent Care coding position moved under HIM • Coding caught up • Increase Revenue due to coder put in charge for E/M codes
DemonstrateCharge Entry/Revenue Protection • Bill hold 6 days • CDM duplicates - Unknown • Incorrect CDM items – Unknown • Item price less than HOPPS APC rate – Unknown
DemonstrateUsing CDM KPI’s • Late Charge Hold Period 2-4 days • CDM Duplicate 0 • CDM Codes Incorrect/Missing CPT HCPCS 0 • CDM item price less than HOPPS APC rate
DemonstrateUsing CDM KPI’s • Worked with Departments and taught department directors how to review rejected charge reports, revenue reports, and enforced late charge policy • Increase revenue and reduced late charges for many departments other lost their revenue already not being billed • Discovered duplicate and incorrect CDM codes and prices below APC rate –Some rates hadn’t been updated since going on the system 2 years prior • Updated CDM and improved revenue, payment, and billing compliance
DemonstrateKPI’s Business Office • Discharge Not Final Billed (DNFB) 11.1 • A/R Days 58.5 Gross (67 Net) • Days in Total Discharge Not Submitted to Payer (DNSP) – Not Tracked • Days Final Billed Not Submitted to Payer (FBNS) • Insurance A/R aged more than 90 days from service/discharge 31% (w/o Self-Pay 19%)