Download
1 / 10
100 likes | 295 Vues
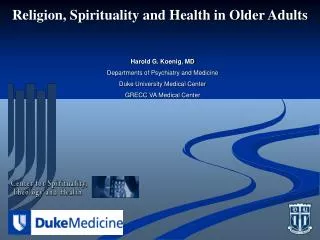
진 욱 Wook Jin 경희대학교 동서신의학병원 East-West Neo Medical Center, Kyung Hee University Patient Information 1. Male/48 years old 2. C/C: Pain in right iliac bone area on position change. Pelvis inlet view. T2W axial image. T1W axial image. Enhanced T1W axial image.

E N D
진 욱 Wook Jin 경희대학교 동서신의학병원 East-West Neo Medical Center, Kyung Hee University Patient Information 1. Male/48 years old 2. C/C: Pain in right iliac bone area on position change
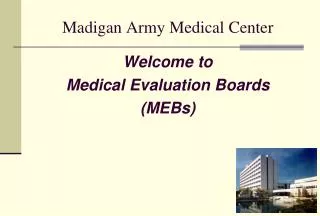
T2W axial image T1W axial image Enhanced T1W axial image
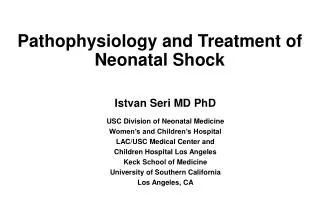
Answer: Intraosseous lipoma (stage 3 according to Milgram’s classification) • Findings: • Plain radiograph • Well-defined huge radiolucent lesion with thin sclerotic rim and inner • radiopaque septa-like structures in right iliac bone • Inner calcifications are suggested between septa-like structures. • 2. MRI • Well defined intraosseous lesion with thin sclerotic rim and • ridge-like sclerotic structures in right iliac bone. • High signal intensities on T1 and T2WIs corresponding to fat • High signal intensities on T2WIs, low signal intensities on T1WIs, • and perpherally thin wall enhancements, corresponding to cyst or necrosis • formations. • No extension of lesion into muscles. • Differential Diagnosis: • 1. Fibrous dysplasia 2. Degeneratiing simple bonne cyst with intraosseous fat deposition 3. Low grade liposarcoma 4. Liposclerosing myxofibrous tumor
C C L T
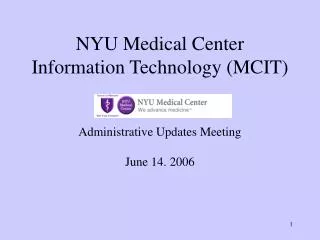
Diagnosis: Intraosseous lipoma with cystic changes in right iliac bone by bone biopsy Discussion: 1. Clinical features 0.1% of bone tumors Common sites ; intertrochanteric and subtrochanteric regiosn of the femur calcaneus, flat bone, pelvis 2. Histopathology By Milgram (with 66 cases of intraosseous lipoma) stage 1; solid tumors of viable lipocysts stage 2; transitional cases with partial fat necrosis and focal calcification but also regions of viable lipocysts stage 3; advanced cases in which fat cells have died with variable degree of cyst formation, calcification, and reactive new bone formation the progression from stage I to stage III is cuased by ischemia and infarction within the lesion and may be related to the rigid honeycomb structure of bone and fat cell expansion and multiplication
3. Radiographic Features Often parallel those of the histologic stage of the lesion The stage 1 - lucent and represent viable, nonnecrotic fat with resorption of bony trabeculae The stage 2 – lucent area, which consist of viable fat and radiodense areas that consist of fat necrosis and dystrophic calcification The stage 3 can be expansile. reflect resorption of normal bone, but they are more radiodense than stage 1 or 2 lesions the radiodensity is a result of calcification and extensive fat necrosis thick sclerotic border, presumably related to involution of these lesions
4. CT Features The stage 1 resorption of bone trabeculae in the lesion and bone expansion the area of lucency seen on the radiograph corresponds to fat attenuation visible on CT The stage 2 area of fat attenuation and patchy areas of increased density corresponding to calcification and fat necrosis The stage 3 the most difficult to diagnose because of the reactive ossification, calcification, fat necrosis, and cyst formation caused by necrosis of the fat component.
5. MR Imaging Features The stage 1 viable fat, which is isointense to subcutaneous fat on T1 and T2WIs a thin circumferential rim of low signal intensity on T1 and T2WIs is typically present demarcating the margin of the fatty lesion consistent with reactive sclerosis surrounding the lesion The stage 2 can again identify fat and the circumferential rim of decreased signal on T1 and T2WIs low signal intensity areas within the central portion of the lesion on T1 and T2WIs are consistent with calcifications The stage 3 a thin peripheral rim of fat, which can be identified on MR imaging. central calcification and a thick rim of surrounding sclerosis, which have low signal intensity on T1 and T2WIs. area of fat necrosis have a variable signal on T1WIs and increased signal on T2WIs.
References: 1. Propeck T, Bullard MA, Lin J, Doi K, Martel W. Radiographic-pathologic correlation of intraosseous lipomas. AJR Am J Roentgenol 2000; 175:673-678 2. Milgram JW. Intraosseous lipomas: radiologic and pathologic manifestation. Radiology 1988; 167:155-160 3. Blacksin MF, Ende N, Benevenia J. Magnetic resonance imaging of intraosseous lipoma: a radiologic-pathologic correlation. Skeletal Radiol 1995; 24:37-41 4. Milgram JW. Intraosseous lipoma. Clin Orthop 1988; 231:277-301