Download

1 / 52
560 likes | 947 Vues
Cost of Capital. 11. PPT 11-2. Chapter 11 - Outline . Cost of Capital Cost of Debt Cost of Preferred Stock Cost of Common Equity: Common Stock Retained Earnings Optimum Capital Structure Marginal Cost of Capital The Security of Market Line Summary and Conclusions.

E N D
PPT 11-2 Chapter 11 - Outline • Cost of Capital • Cost of Debt • Cost of Preferred Stock • Cost of Common Equity: • Common Stock • Retained Earnings • Optimum Capital Structure • Marginal Cost of Capital • The Security of Market Line • Summary and Conclusions
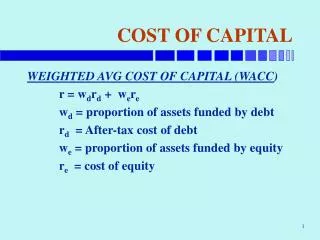
Cost of Capital PPT 11-3 • The cost of capital represents the overall cost of future financing to the firm • The cost of capital is normally the relevant discount rate to use in analyzing an investment • It represents the minimal acceptable return from the investment • If your cost of funds is 10%, you must earn at least 10% on your investments to break even! • The cost of capital is a weighted average of the various sources of funds in the form of debt and equity WACC = Weighted Average Cost of Capital
Steps in measuring a firm’s cost of capital 1. Compute the cost of each source of capital. 2. Assign weights to each source. Conversion of historical cost of capital structure to market values may be required. 3. Compute the weighted average of the component costs.
Cost of Debt • Measured by interest rate, or yield, paid to bondholders • Example: $1,000 bond paying $100 annual interest – 10% yield • Calculation is complex discount rate or premium from par value bonds • To determine the cost of a new debt in the marketplace: • The firm will compute the yield on its currently outstanding debt
Approximate Yield to Maturity (Y') Principal payment – Price of the bond Annual interest payment + Number of years to maturity 0.6 (Price of the bond) + 0.4 (Principal payment) • Assuming: Y'= $101. 50 + 20 .6 ($940) + .4 ($1,000) = $101.50 + 20 $564 + $400 Y’ = $101.50 + 3 = $104.50 = 10.84% $964 $964 $1,000 - $940 60
Tax and flotation cost consideration • Market-determined yields on various financial instruments will equal the cost of those instruments to the firm with adjustment tax and flotation cost consideration
Adjusting Yield for Tax Considerations • Yield to maturity indicates how much the firm has to pay on a before-tax basis • Interest payment on a debt is a tax-deductible expense • Due to this, the true cost is less than the stated cost
Adjusting Yield for Tax Considerations (cont’d) • The after-tax cost of debt is calculated as shown below: • Assuming:
PPT 11-6 Yield of Preferred Stock Preferred stock: • has a fixed dividend (similar to debt) • has no maturity date • dividends are not tax deductible and are expected to be perpetual or infinite Yield of preferred stock = annual dividend price of stock Yield of new preferred stock = annual dividend price-flotation costs Flotation costs: selling and distribution costs (such as sales commissions) for the new securities
Cost of Preferred Stock (cont’d) • The cost of preferred stock is as follows: • Where, = Cost of preferred stock; = Annual dividend on preferred stock; = Price of preferred stock; F = Floatation, or selling cost • Assuming annual dividend as $10.50, preferred stock is $100, and flotation, or selling cost is $4. Effective cost is: = $10.50 = $10.50 = 10.94% $100 - $4 $96
Cost of Common Equity – Valuation Approach • In determining the cost of common stock, the firm must be sensitive to pricing and performance demands of current and future stockholders • Dividend valuation model: • Where, = Price of the stock today; = Dividend at the end of the year (or period); = Required rate of return; g = Constant growth rate in dividends • Assuming = $2; = $40 and g = 7%, equals 12 percent = $2 + 7% = 5% + 7% = 12% $40
Alternate Calculation of the Required Return on Common Stock • Capital asset pricing model (CAPM) • Where: = Required return on common stock; = Risk-free rate of return, usually the current rate on Treasury bill securities; = Beta coefficient (measures the historical volatility of an individual stock’s return relative to a stock market index; = return in the market as measured by an approximate index • Assuming = 5.5%, = 12%, = 1.0, would be: = 5.5% + 1.0 (12% - 5.5%) = 5.5% + 1.0 (6.5%) = 5.5% + 6.5% = 12%
Cost of Retained Earnings • Sources of capital for common stock equity: • Purchaser of the new shares – external source • Retained earnings – internal source • Represent the present and past earnings of the firm minus previously distributed dividends • Belong to the current stockholders – may be paid in the form of dividends or reinvested in the firm • Reinvestments represent a source of equity capital supplied by the current stockholders • An opportunity cost is involved
Cost of Retained Earnings (cont’d) • The cost of retained earnings is equivalent to the rate of return on the firm’s common cost representing the opportunity cost • represents both the required rate of return on common stock, and the cost of equity in the form of retained earnings • For ease of reference, = Cost of common equity in the form of retained earnings = Dividend at the end of the first year, $2 = Price of stock today, $40 g = Constant growth rate in dividends, 7% = $2 + 7% = 5% + 7% = 12% $40
Cost of New Common Stock • A slightly higher return than , representing the required rate of return of present stockholders, is expected • Needed to cover the distribution costs of the new securities Common stock New common stock
Cost of New Common Stock (cont’d) • Assuming = $2, = $40, F (Flotation or selling costs) = $4 and g = 7%; = $2 + 7% $40 - $4 = $2 + 7% $36 = 5.6% + 7% = 12.6%
Optimum Capital Structure PPT 11-8 The optimum (best) situation is associated with the minimum overall cost of capital: • Optimum capital structure means the lowest WACC • Usually occurs with 40-70% debt in a firm’s capital structure • WACC is also referred to as the required rate of return or the discount rate • Based upon the market value rather than the book value of the firm’s debt and equity
Optimal Capital Structure – Weighting Costs (cont’d) • Assessment of different plans (next slide): • Firm is able to initially reduce weighted average cost of capital with debt financing • Beyond Plan B, continued use of debt becomes unattractive and greatly increases costs of sources of financing
Optimal Capital Structure – Weighting Costs (cont’d) Cost (After-tax) Weights Weighted Cost Financial Plan A: Debt………………………… 6.5% 20% 1.3% Equity………………………. 12.0 80 9.6 10.9% Financial Plan B: Debt………………………… 7.0% 40% 2.8% Equity………………………. 12.5 60 7.5 10.3% Financial Plan C: Debt………………………… 9.0% 60% 5.4% Equity………………………. 15.0 40 6.0 11.4%
Capital acquisition and investment decision making • The discount rate used in evaluating capital projects should be the weighted average cost of capital. • If the cost of capital is earned on all projects, the residual claimants of the earnings stream, the owners, will receive their required rate of return. If the overall return of the firm is less than the cost of capital, the owners will receive less than their desired rate of return because providers of debt capital must be paid. • For most firms, the cost of capital is fairly constant within a reasonable range of debt-equity mixes. Changes in money and capital market conditions (supply and demand for money), however, cause the cost of capital for all firms to vary upward and downward over time.
Cost of capital over time Cost of capital (Ka) Kat Kat + 1 Kat + 2 y x Debt-equity mix (percent)
Percent --------- 16.0 14.0 12.0 10.0 8.0 6.0 4.0 2.0 0.0 A B C 10.41% D Weighted average cost of capital Ka E F G H 39 50 95 70 85 10 15 19 Amount of capital ($ millions) Cost of capital and investment projects for the Baker Corporation
The Marginal Cost of Capital • The market may demand a higher cost of capital for each amount of fund required if a large amount of financing is required • Equity (ownership) capital is represented by retained earnings • Retained earnings cannot grow indefinitely as the firm’s capital needs to expand • Retained earnings is limited to the amount of past and present earnings that can be redeployed into investments
The Marginal Cost of Capital (cont’d) • Assumptions: • 60% is the amount of equity capital a firm must maintain to keep a balance between fixed income securities and ownership interest • Baker Corporation has $23.40 million of retained earning available for investment • There is adequate retained earning to support the capital structure as shown below: • Assuming: X = Retained earnings ; Percent of retained earnings in the capital structure • Where X represents the size of the capital structure that retained earnings will support X = $23.40 million = $39 million .60
Increasing Marginal Cost of Capital • Both and represent the cost of capital • The mc subscript after K indicates the increase in cost of capital • Increase is because common equity is now in the form of new common stock rather than retained earnings • The aftertax cost of the new common stock is more expensive than retained earnings because of flotation costs
Increasing Marginal Cost of Capital (cont’d) • Equation for the cost of new common stock: = $2 + 7% = $2 + 7% = 5.6% + 7% = 12.6% $40 - $4 $36 • The $50 million figure can be derived thus: Z = Amount of lower-cost debt ; Percent of debt in the capital structure Z = $15 million = $50 million .30 • Where Z represents the size of the capital structure in which lower-cost debt can be used
Percent --------- 16.0 14.0 12.0 10.0 8.0 6.0 4.0 2.0 0.0 A 10.77% B 11.23% C Marginal cost of capital Kmc 10.41% E D F G H 39 50 95 70 85 10 15 19 Amount of capital ($ millions) PPT 11-16 Marginal cost of capital and Baker Corporation investment alternatives
Basic form of the CAPM The basic form of the CAPM is a linear relationship between returns on individual stocks and the market over time. Using least squares regression analysis, the return Kj = α + βRm + e Where: Kj = return on individual common stock of company α = Alpha, the intercept on the y-axis β = Beta, the coefficient Rm = Return on the stock market e = Error term of the regression equation
PPT 11-18 Table 11A-1Performance of PAI and the market Rate of Return on Stock Year PAI Market 1 . . . . . . . . . . . . 12.0% 10.0% 2 . . . . . . . . . . . . 16.0 18.0 3 . . . . . . . . . . . . 20.0 16.0 4 . . . . . . . . . . . . 16.0 10.0 5 . . . . . . . . . . . . 6.0 8.0 Mean return 14.0% 12.4% Standard deviation 4.73% 3.87%
Return on PAI common stock Kj Kj = j Rm + ej = 2.8 + .9 (Rm ) + ej Percent 21.0 15.0 9.0 3.0 (y) (3) (4) (1) (2) .9 Beta = j = Slope of the line (5) 2.8 Rm 3.0 9.0 15.0 21.0 Return on the market Rm (x) Linear regression of returns between PAI and the market
PPT 11-20 Linear regression of returns between PAI and the market Kj Rm Kj Rm Rm2 ( Rm )2 936 4,340 844 3,844 Year Kj Rm 1. . . . . 12% 10% 2. . . . . 16% 18% 3. . . . . 20% 16% 4. . . . . 16% 10% 5. . . . . 6% 8% 70% 62% n Kj Rm – Kj Rm 5(936) - 4,340 j n Rm2– ( Rm )25(844) - 3,844 Kj – Rm 70 - 0.9 (62) n 5
Calculator Mode: Stat Input 10 (x,y) 12 Data 18 (x,y) 16 Data 16 (x,y) 20 Data 10 (x,y) 16 Data 8 (x,y) 6 Data 2ndF a gives 2.79 2ndF b gives .90 2ndF r gives .74 Note that the values for the x axis(Rm) are input first This is the alpha coefficient This is the beta coefficient This is the correlation coefficient, a measure of how well the formula describes the relationship. The closer to 1.00, the better the fit PPT 11-21 Linear regression of returns between PAI and the market
Improved CAPM (risk premium model) Investors expect higher returns if higher risks are taken Kj = Rf + β(Rm-Rf) Where: Kj= Required return on Common Stock Rf= Risk-free rate of return β= Beta coefficient. The beta measures the historical volatility of an individual stock's return relative to a stock market index. A beta greater than 1 indicates greater volatility (price movements) than the market, while the reverse would be true for a beta less than 1. Rm-Rf _= Premium or excess return of the market versus the risk-free rate. β(Rm-Rf) = Expect return above the risk-free rate for the stock of company j, given the level of risk.
Required rates of return Percent 20.0 18.0 16.0 14.0 12.0 10.0 8.0 5.5 SML = Rf + (Rm – Rf) K2 K1 6.5 % market risk premium K.5 Rf 0.5 1.0 1.5 2.0 Beta (risk) The security market line (SML)
The security market line and changing interest rates SML1 Required rates of return (percent) 20.0 18.0 16.0 14.0 12.0 10.0 7.5 5.5 SML0 Rf increased 2% Rf1 Rf0 0.5 1.0 1.5 2.0 Beta (risk)
Required rates of return (percent) SML1 22.0 20.0 18.0 16.0 14.0 12.0 10.0 8.0 5.5 More risk aversion SML0 Beta (risk) PPT 11-24 The security market line and changing investor expectations Rf 0.5 1.0 1.5 2.0
Net income (NI) approach Value of the firm ($) Cost of capital (percent) Ke Ka Kd 100 0 0 100 Debt/value ratio (percent) Debt/value ratio (percent) Ke= Cost of Equity: Kd = Cost of debt; Ka = Cost of capital Value is the market value of the firm
Net operating income (NOI) approach Value of the firm ($) Cost of capital (percent) Ke Ka Kd 0 100 0 100 Debt/value ratio (percent) Debt/value ratio (percent)
Traditional approach as described by Durand Cost of capital (percent) Value of the firm ($) Ke Ka Kd 0 100 0 100 Debt/value ratio (percent) Debt/value ratio (percent)
Modigliani and Miller with corporate taxes Value of the firm ($) Cost of capital (percent) Ke VL VU Ka Cost of debt adjusted for the tax effect of interest Kd 0 100 0 100 Debt/value ratio (percent) Debt/value ratio (percent)