Download
1 / 27
270 likes | 416 Vues
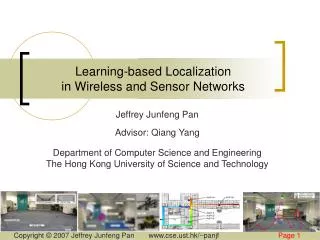
Using Area-based Presentations and Metrics for Localization Systems in Wireless LANs. Eiman Elnahrawy, Xiaoyan Li, and Richard Martin Dept. of Computer Science, Rutgers University WLN, November 16 th 2004. WLAN-Based Localization.

E N D
Using Area-based Presentations and Metrics for Localization Systems in Wireless LANs Eiman Elnahrawy, Xiaoyan Li, and Richard Martin Dept. of Computer Science, Rutgers University WLN, November 16th 2004
WLAN-Based Localization • Localization in indoor environments using 802.11 and Fingerprinting • Numerous useful applications • Dual use infrastructure: a huge advantage Dept. of Computer Science, Rutgers University
[(x,y),s1,s2,s3] [(x,y),s1,s2,s3] [(x,y),s1,s2,s3] Background: Fingerprinting Localization RSS • Classifiers/matching/learning approaches • Offline phase: • Collect training data (fingerprints) • Fingerprint vectors: [(x,y),SS] • Online phase: • Match RSS to existing fingerprints probabilistically or using a distance metric [-80,-67,-50] (x?,y?) Dept. of Computer Science, Rutgers University
Output: • A single location: the closest/best match • We call such approaches “Point-based Localization” • Examples: • RADAR • Probabilistic approaches [Bahl00, Ladd02, Roos02, Smailagic02, Youssef03, Krishnan04] Dept. of Computer Science, Rutgers University
Contributions: Area-based Localization • Returned answer is area/volume likely to contain the localized object • Area is described by a set of tiles • Ability to describe uncertainty • Set of highly possible locations Dept. of Computer Science, Rutgers University
Contributions: Area-based Localization • Show that it has critical advantages over point-based localization • Introduce new performance metrics • Present two novel algorithms: SPM and ABP-c • Evaluate our algorithms and compare them against traditional point-based approaches • Related Work: different technologies/algorithms [Want92, Priyantha00, Doherty01, Niculescue01, Savvides01, Shang03, He03, Hazas03, Lorincz04] Dept. of Computer Science, Rutgers University
Why Area-based? • Noise and systematic errors introduce position uncertainty • Areas improve system’s ability to givemeaningful alternatives • A tool for understanding the confidence • Ability to trade Precision(area size) for Accuracy(distance the localized object is from the area) • Direct users in their search • Yields higher overall accuracy • Previous approaches that attempted to use areas only use them as intermediate result output still a single location Dept. of Computer Science, Rutgers University
Area-based vs. Single-Location 80 • Object can be in a single room or multiple rooms • Point-based to areas • Enclosing circles --much larger • Rectangle? no longer point-based! 70 60 50 40 30 20 10 0 0 200 0 200 Dept. of Computer Science, Rutgers University
Outline • Introduction, Motivations, and Related Work • Area-based vs. Point-based localization • Metrics • Localization Algorithms • Simple Point Matching (SPM) • Area-based Probability (ABP-c) • Interpolated Map Grid (IMG) • Experimental Evaluation • Conclusion, Ongoing and Future Work Dept. of Computer Science, Rutgers University
Performance Metrics • Traditional: Distance error between returned and true position • Return avg, 95th percentile, or full CDF • Does not apply to area-based algorithms! • Does not show accuracy-precision tradeoffs! Dept. of Computer Science, Rutgers University
New Metrics: Accuracy Vs. Precision • Tile Accuracy % true tile is returned • Distance Accuracy distance between true tile and returned tiles (sort and use percentiles to capture distribution) • Precision size of returned area (e.g., sq.ft.) or % floor size Dept. of Computer Science, Rutgers University
Room-Level Metrics • Applications usually operate at the level of rooms • Mapping: divide floor into rooms and map tiles • (Point ↔ Room): easy • (Area ↔ Room): tricky • Metrics: accuracy-precision • Room Accuracy % true room is the returned room • Top-n rooms Accuracy % true room is among the returned rooms • Room Precision avg number of returned rooms Dept. of Computer Science, Rutgers University
∩ ∩ = 1. Simple Point Matching (SPM) • Build a regular grid of tiles, tile ↔ expected fingerprint • Find ∩ tiles which fall within a “threshold”of RSS for each AP • Eager: start from low threshold (= δ, 2 × δ, …) • Threshold is picked based on the standard deviation of the received signal • Similar to Maximum Likelihood Estimation Dept. of Computer Science, Rutgers University
2. Area-Based Probability (ABP-c) Build a regular grid of tiles, tile ↔ expected fingerprint Using “Bayes’ rule” compute likelihood of an RSS matching the fingerprint for each tile p(Ti|RSS) α p(RSS|Ti) . p(Ti) Return top tiles bounded by an overall probability that the object lies in the area (Confidence: user-defined) Confidence ↑→ Area size ↑ Dept. of Computer Science, Rutgers University
90 85 80 75 70 65 60 140 55 50 45 40 y in feet 0 210 x in feet Measurement At Each Tile Is Expensive! • Interpolated Map Grid: (Surface Fitting) • Goal: Extends original training data to cover the entire floor by deriving an expected fingerprint in each tile • Triangle-based linear interpolation using “Delaunay Triangulation” • Advantages: • Simple, fast, and efficient • Insensitive to the tile size Dept. of Computer Science, Rutgers University
Impact of Training on IMG • Bothlocationand number of training samples impact accuracy of the map, and localization performance • Number of samples has an impact, but not strong! • Little difference going from 30-115, no difference using > 115 training samples • Different strategies [Fixed spacing vs. Average spacing]: as long as samples are “uniformly distributed” but not necessarily “uniformly spaced” methodology has no measurable effect Dept. of Computer Science, Rutgers University
Experimental Setup • CoRE • 802.11 data: 286 fingerprints (rooms + hallways) • 50 rooms • 200x80 feet • 4 Access Points Dept. of Computer Science, Rutgers University
Average Overall Room Accuracy Average Overall Precision 100 10 SPM ABP-50 95 ABP-75 8 ABP-95 90 85 6 % accuracy 80 % floor 4 75 SPM 70 ABP-50 2 ABP-75 65 ABP-95 60 0 0 50 100 150 200 250 0 50 100 150 200 250 Training data size Training data size Area-based Approaches: Accuracy-Precision Tradeoffs • Improving Accuracy worsens Precision(tradeoff) Dept. of Computer Science, Rutgers University
ABP-50: Percentiles' CDF ABP-75: Percentiles' CDF 1 1 0.8 0.8 probability probability 0.6 0.6 0.4 0.4 Minimum Minimum 25 Percentile 25 Percentile 0.2 0.2 Median Median 75 Percentile 75 Percentile Maximum Maximum 0 0 0 20 40 60 80 100 0 20 40 60 80 100 ABP-95: Percentiles' CDF 1 0.8 0.6 probability 0.4 Minimum 25 Percentile 0.2 Median 75 Percentile Maximum 0 0 20 40 60 80 100 distance in feet A Deeper Look Into “Accuracy” SPM: Percentiles' CDF 1 0.8 0.6 probability 0.4 Minimum 25 Percentile 0.2 Median 75 Percentile Maximum Dept. of Computer Science, Rutgers University 0 0 20 40 60 80 100 distance in feet
ABP-50 ABP-75 SPM ABP-95 Sample Outputs • Area expands into the true room • Areas illustrate bias across different dimensions (APs’ location) Dept. of Computer Science, Rutgers University
Comparison With Point-based localization: Evaluated Algorithms • RADAR • Return the “closest” fingerprint to the RSS in the training set using “Euclidean Distance in signal space” (R1) • Averaged RADAR (R2), Gridded RADAR (GR) • Highest Probability • Similar to ABP: a typical approach that uses “Bayes’ rule” but returns the “highest probability single location” (P1) • Averaged Highest Probability (P2), Gridded Highest Probability (GP) Dept. of Computer Science, Rutgers University
Comparison With Point-based Localization: Performance Metrics • Traditional error along with percentiles CDF for area-based algorithms (min, median, max) • Room-level accuracy Dept. of Computer Science, Rutgers University
Min Median Max CDFs for point-based algorithms fall in-between the min, max CDFs for area-based algorithms Point-based algorithms perform more or less the same, closely matching the median CDF of area-based algorithms Dept. of Computer Science, Rutgers University
Similar top-room accuracy Area-based algorithms are superior at returning multiple rooms, yielding higher overall room accuracy If the true room is missed in point-based algorithms the user has no clue! Dept. of Computer Science, Rutgers University
Conclusion • Area-based algorithms present users a more intuitive way to reason about localization uncertainty • Novel area-based algorithms and performance metrics • Evaluations showed that qualitatively all the algorithms are quite similar in terms of their accuracy • Area-based approaches however direct users in their search for the object by returning an ordered set of likely rooms and illustrate confidence Dept. of Computer Science, Rutgers University
Ongoing and Future Work • Eiman Elnahrawy, Xiaoyan Li, and Richard P. Martin, “The Limits of Localization Using Signal Strength: A Comparative Study”, In IEEE SECON 2004 • All algorithms behave the same: there is a fundamental uncertainty due to environmental effects! • Point-based approaches find the peaks in the PDFs • Area-based approaches explore more of the PDF but cannot narrow it (cannot eliminate the uncertainty) • Useful accuracy, different ways to describe it to users • Future work: additional HW or complex models to improve accuracy Dept. of Computer Science, Rutgers University
Thank You Dept. of Computer Science, Rutgers University