Download
1 / 24
240 likes | 328 Vues
Explore Minnesota's goals and strategies for recycling beverage containers, including producer programs, disposal bans, and stakeholder initiatives for a sustainable future by 2012. Find data sources, current rates, and stakeholder recommendations.

E N D
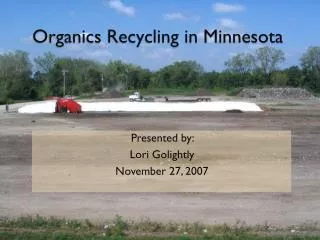
Beverage Container Recycling in Minnesota Solid Waste Management Coordinating Board Board Meeting 9-23-09
2007 Solid Waste Policy Report • The 2007 Solid Waste Policy Report set a goal to recycle 80 percent of beverage containers in Minnesota by 2012. • The MPCA committed to consider these options: • A producer responsibility program for the collection and recycling of beverage containers. • A traditional container deposit program. • A disposal ban on beverage containers.
Beverage Container Product Stewardship Initiative • Held 4 stakeholder meetings between September 2008 and January 2009. • Stakeholders were responsible for developing strategies that could advance the State toward the 80% goal. • Container deposit was not discussed. • Complete report is available here: http://www.pca.state.mn.us/oea/publications/w-ps1-02.pdf
Data Sources • (SCORE) – The Governor’s Select Committee on Recycling and Environment • (CRI) The Container Recycling Institute • Statewide Waste Composition Studies • Minneapolis Curbside Recycling Rate Studies (Capture Rate) • City of Minneapolis Recycling Data • Waste-To-Energy Facility Waste Sorts • Olmsted County • Hennepin County • Sales Data from the Minnesota Beverage Association • State of Minnesota Liquor Tax Data
Current Recycling Rate in MN • The recycling rate was calculated in 10 different ways using various data sources. • The average recycling rate for beverage containers are as follows: • Aluminum cans 33% • Glass bottles 47% • PET bottles 24% • All Containers 35%
SCORE • MN recycling rate for all materials has remained between 40% and 45% since 1999. • SCORE data is not beverage container specific, but trends and progress can be shown. Dates back to 1993.
Capture Rate Study • Hennepin County collaborated with the City of Minneapolis to complete a capture rate study in 2005. Curbside data with 870 random homes selected in 69 of the 81 neighborhoods of Minneapolis. • The curbside recycling rates for beverage containers : • Metal Cans 29.32% • Plastic Bottles 30.59% • Glass 51.45% • The curbside recycling rate for all recyclables was 44.47% • Most accurate curbside recycling rates, recommended by MBA Consultant.
Waste Composition Study • Minnesota’s most recent statewide waste composition study was completed in 1999. Previous was 1992. • 128,160 tons of containers
Olmsted Waste to Energy • Little info regarding methodology, report has not been located as of now, just the results. • 165,896 Tons of Containers
HERC Waste To Energy Sort • Waste sort from the tipping floor of Hennepin Energy Resource Company • Beverage containers are not specifically called out
Container Recycling Institute – Beverage Marketing Data Analysis • CRI is a national group that supports container deposit legislation. • Provide data for all 50 states. • Includes sales data, estimated recovery from container deposits, and estimated revenue from unredeemed deposits under 5 and 10 cent scenarios.
Beverage Association Data • Sales data generated from Beverage Marketing Data and statewide survey. • Only data for carbonated alcohol and non-alcoholic beverages. • Lower sales than CRI reports for carbonated beverages.
Beverage Association Data • MBA was concerned that State estimates in the 2007 Policy Report indicated that we recycled more aluminum than was sold.
Liquor Tax Data • Tracks the sales of alcoholic beverages in MN. • Data reported as gallons sold, which can be converted to units and tons.
State of MN Trend Estimates • Trends indicate that we are collecting a smaller percentage of beverage containers each year. • Not just MN, but nationally as well.
Stakeholder Recommendations • Financial Incentives (RecycleBank) • Curbside Organics Collection • Extend Opportunity to Recycle to Multi-Family and Commercial • Dedicated Container Collection (Message in a Bottle) • Disposal Ban • Increase Education
Conclusion of Product Stewardship Initiative • Currently recycling 35% of beverage containers in MN. • In order to achieve 80% recycling of these containers, collection needs to more than double. • Many of the strategies require legislative action • Due to the complexity and cost of the strategies developed, along with substantial stakeholder commitment, the State is unlikely to achieve the 80% goal by 2012.
Producer Responsibility (Packaging) • Ontario (Liquor Deposit) • Aluminum 44% • Plastic 22% • Glass 69% • Germany (Container Deposit) • Aluminum 76% • Plastic 38% • Glass 82% • Japan • Aluminum 89% • Plastic 75% • Glass 90% • Australia • Aluminum 70% • Plastic 33% • Glass 38%
Container Deposit • There are 11 states with Container Deposit Laws. • The recycling rates vary: • Lowest (Massachusetts) 72% • Average 78% • Highest (Michigan) 95% • Michigan has a 10 cent deposit, the rest have 5 cent deposits. • Most laws only include 79% of all beverage containers.
Disposal Ban • Nova Scotia • No data from the ban, paired with container deposit, so it is difficult to identify diversion due to the ban. • North Carolina • No data yet. Goes into effect on October 1, 2009 • Wisconsin (Conditional Ban) • 1994 Before Ban • Aluminum Tons 3,819 • Glass Tons 49,371 • Plastic Tons 12,017 • 1995 After Ban • Aluminum Tons 5,849 • Glass Tons 71,488 • Plastic Tons 19,415
Questions? peder.sandhei@state.mn.us