Climate Impact Assessment in Asia-Pacific: Emission Trends and Future Projections
160 likes | 278 Vues
This report provides a comprehensive analysis of CO2 and SO2 emissions across various Asia-Pacific nations with projections extending to 2030 and beyond. It emphasizes the implications of climate change on agriculture, health, and ecosystems, while presenting data on GDP loss, productivity changes, and climate sensitivity scenarios. Key findings reveal significant potential shifts in forest types, water demand, and malaria risk due to changing climatic conditions. The findings aim to facilitate informed decision-making for sustainable development and adaptation strategies in the region.

Climate Impact Assessment in Asia-Pacific: Emission Trends and Future Projections
E N D
Presentation Transcript
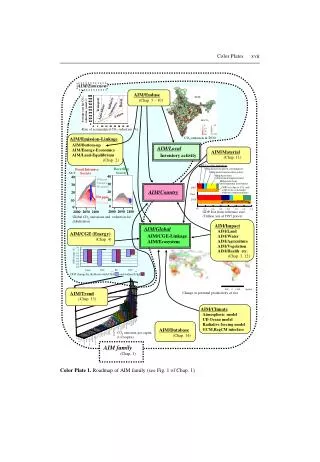
12 10 8 6 4 Brunei Palau Singapore Kazakhstan Korea, Rep Nauru Australia Korea, Dem Japan Taiwan Malaysia Iran Mongolia Turkmenistan Uzbekistan China 2 Thailand Tonga New Zealand Fiji India French Polynesia Philippines Samoa Tajikistan Kyrgyz Republic Indonesia Maldives Sri Lanka Vietnam Nepal 0 Myanmar Pakistan Vanuatu 2032 2025 Kiribati Laos 2015 Bangladesh 2005 1995 Bhutan Papua New Guinea Year Cambodia Solomon Islands Color Plates xvii AIM/Emission AIM/Enduse (Chap. 5 – 10) 2030 2 Mt-CO2 <3 >21 5 10 20 40 Rate of accumulated CO2 reduction (%) CO2 emission in 2030 AIM/Emission-Linkage AIM/Bottom-up AIM/Energy-Economics AIM/Land-Equilibrium (Chap. 2) AIM/Local AIM/Material (Chap. 11) Inventory activity CO2 AIM/Country GDP loss from reference case (Trillion yen at 1995 prices) • AIM/Impact • AIM/Land • AIM/Water • AIM/Agriculture • AIM/Vegetation • AIM/Health etc. • (Chap. 3, 12) AIM/Global AIM/CGE (Energy) (Chap. 4) AIM/CGE-Linkage AIM/Ecosystem GDP change by the Kyoto with USA and without USA -500 0 +500 (kg/ha) Change in potential productivity of rice AIM/Trend (Chap. 13) AIM/Climate Atmospheric model UD Ocean model Radiative forcing model GCM,RegCM interface AIM/Database (Chap. 14) CO2 emission per capita (t-C/capita) AIM family (Chap. 1) Color Plate 1. Roadmap of AIM family (see Fig. 1 of Chap. 1)
xviii Color Plates Color Plate 2. Framework of the AIM/Impact model (see Fig. 1 of Chap. 3) Color Plate 3. Change in the potential productivity of rice from 1990 to 2050 under the climatic conditions projected using the CCSR/NIES GCM (see Fig. 4 of Chap. 3)
Color Plates xix IS92c scenario with low climate sensitivity IS92a scenario with medium climate sensitivity IS92e scenario with high climate sensitivity Tropical rainforest Subtropical forest Dry tropical forest Savanna Hot desert Cool desert Steppe Warm temperate forest Cool temperate forest Chaparral Cool forest Boreal forest Tundra Polar desert Cells are classified to a forest type under the present climate and to a non-forest type under the future climate (diminishment of forest). Cells are classified to a forest type under the present climate and to a different forest type under the future climate, but the shift cannot occur smoothly (replacement of the forest type with the risk of diminishment). Cells are classified to a non-forest type under the present climate and to a forest type under the future climate, but the shift cannot occur smoothly. Color Plate 4. Forest collapse under low, mid, high-climate change scenarios (IS92c emissions with low climate sensitivity, IS92a emissions with medium climate sensitivity, IS92e emissions with high climate sensitivity) (see Fig. 6 of Chap. 3)
xx Color Plates Present (1xCO2) Present (1xCO2) Expected future (2xCO2) endemic low receptivity Color Plate 5. Expansion of the area affected by malaria (Upper: current climate, Lower: 2xCO2 climate change, GCM: GFDL q-flux equilibrium experiment) (see Fig. 8 of Chap. 3) 1990 2050 Color Plate 6. Water demand per unit area in 1990 and 2050 (see Fig. 11 of Chap. 3)
Color Plates xxi CCC ECHAM4 CCSR/NIES Color Plate 7. Changes in runoff calculated based on the results of the transient experiments of the CCC, ECHAM4, and CCSR/NIES climate models (mean runoff for the 10 years from 2050 to 2059 minus mean runoff for the 10 years from 1980 to 1989) (see Fig. 12 of Chap. 3)
-100 -90 -80 -70 -60 Change of productivity (%) -50 -40 -30 -20 -10 0 Myanmar Cambodia Malaysia Thailand Philippines Lao PDR Nepal Bangladesh Viet Nam India Sri Lanka Reference Indonesia Bhutan Taiwan WRE550 China WGI 550 Korea DPR MID 550 Japan Korea Republic Scenario 250 200 150 Change of malaria risk (%) 100 50 c 0 China Nepal Taiwan Sri Lanka Indonesia Thailand India Myanmar Viet Nam Bhutan Lao PDR Reference Korea DPR Japan WRE550 Korea Republic WGI 550 Bangladesh Malaysia MID 550 Cambodia Philippines Scenario xxii Color Plates Color Plate 8. Change in winter wheat productivity from 1990 to 2100 (see Fig. 16 of Chap. 4) Color Plate 9. Change in population living in area at high malaria risk from 1990 to 2100 (see Fig. 18 of Chap. 4)
0 1,000 2,000 3,000 4,000 5,000 6,000 7,000 8,000 9,000 10,000 11,000 12,000 13,000 14,000 15,000 ≧16,000 <kg-SO2/km2> 0 100 200 300 400 500 600 700 800 900 1,000 1,100 1,200 1,300 1,400 1,500 ≧1,600 <t-C/km2> Color Plates xxiii Color Plate 10. CO2 emission intensity in China for 2010 (see Fig. 5 of Chap. 5) Color Plate 11. SO2 emission intensity in China for 2010(see Fig. 6 of Chap. 5)
xxiv Color Plates Mt-CO2 Mt-CO2 Color Plate 12. Regional distribution of CO2 emissions in India for 2000 and 2030 in reference scenario (see Fig. 4 of Chap. 6) Note: Circles show emissions from large point sources.
Color Plates xxv Mt-SO2 Mt-SO2 Color Plate 13. Regional distribution of SO2 emissions in India for 2000 and 2030 in reference scenario (see Fig. 5 of Chap. 6) Note: Circles show emissions from large point sources.
xxvi Color Plates Coal power plant Gas power plant Reference scenario 550 ppmv scenario Mt-CO2 Color Plate 14. Comparison of CO2 emissions from large power plants in reference and 550 ppmv stabilization scenarios in 2030 (see Fig. 7 of Chap. 6)
Color Plates xxvii Color Plate 15. Framework of AIM/Impact [Country] (see Fig. 1 of Chap. 12) Color Plate 16. Concept of AIM/Trend model (see Fig. 1 of Chap. 13)
xxviii Color Plates Color Plate 17. Energy related CO2 emissions in the Asia-Pacific region (see Fig. 9 of Chap. 13) Laos Color Plate 18. Energy related CO2 emissions in sub-regions of the Asia-Pacific region (see Fig. 10 of Chap. 13)
Color Plates xxix Color Plate 19. Energy related SO2 emissions in the Asia-Pacific region (see Fig. 11 of Chap. 13) Laos Color Plate 20. Energy related SO2 emissions in sub-regions of the Asia-Pacific region (see Fig. 12 of Chap. 13)
xxx Color Plates User interface User Display of output with pivot table and chart Import module AIM/Enduse Database Export module Export module AIM/Enduse Database System (MS Access) Input file of GAMS Program AIM/Enduse GAMS program Output file of GAMS Program AIM/Enduse GAMS Program (GAMS) Input file of GIS System AIM/Enduse GIS System (IDRISI 32) MS Access: Database management software designed by Microsoft Corporation GAMS: General algebraic modeling system designed by GAMS Development Corporation IDRISI 32: Geographical information system and image processing software designed by Clark Labs, Clark University Color Plate 21. AIM/Enduse database system, optimization system and GIS (see Fig. 1.4 of Part IV)
Color Plates xxxi Color Plate 22. User interface for technology table (see Appendix C of Part IV ) Color Plate 23. Display of output with pivot table and chart (see Appendix C of Part IV)
xxxii Color Plates Color Plate 24. The Seventh International AIM Workshop, 15-17 March 2002, Tsukuba, Japan Color Plate 25. Photos from the AIM Training Workshop, 5-6 September 2002, Tsukuba, Japan