Download
1 / 54
540 likes | 662 Vues
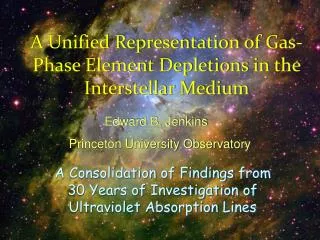
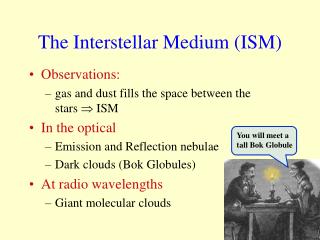
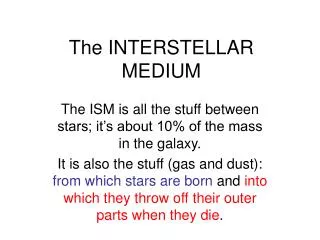
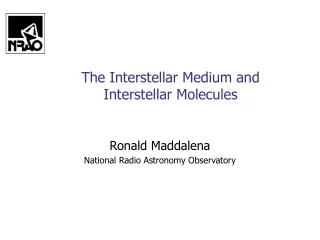
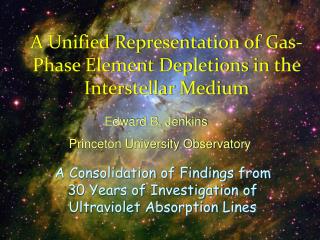
A Unified Representation of Gas-Phase Element Depletions in the Interstellar Medium. Edward B. Jenkins Princeton University Observatory. A Consolidation of Findings from 30 Years of Investigation of Ultraviolet Absorption Lines. Interstellar Dust. Mellinger 2009 arXiv 0908.4360.

E N D
A Unified Representation of Gas-Phase Element Depletions in the Interstellar Medium Edward B. Jenkins Princeton University Observatory A Consolidation of Findings from 30 Years of Investigation of Ultraviolet Absorption Lines
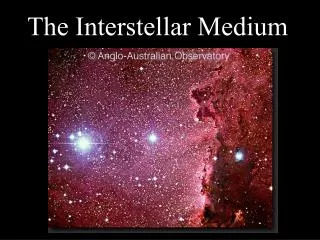
Interstellar Dust Mellinger 2009 arXiv 0908.4360
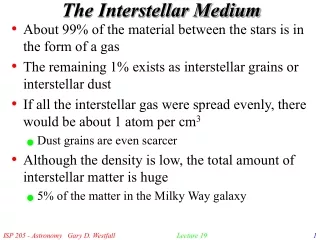
Interstellar Dust NGC 4103
Average Density of Dispersed Solids Refractive index at low freq. Radius of each grain Number of grains per unit area in a column of length d Qe Optical depth Extinction efficiency factor An application of the Kramers-Kronig dispersion relation by Purcell (1969, ApJ, 158, 433)
Average Density of Dispersed Solids Compare with Z/X in the Sun Combine AV = 1.8 mag kpc-1 with relative extinctions from 1000 Å to 20 μm ≈ 2 for most substances ≈ 3 0.018
The Dark Ages Date: Fri, 13 Aug 2004 16:22:40 -0400 (EDT) From: STScI-Generic@stsci.edu To: ebj@astro.princeton.edu Subject: STIS Update Dear HST User, On Tuesday, August 3, STIS entered a "suspend" state in response to the loss of 5-volt power in the Side 2 electronics. The Side 1 electronics suffered a short circuit in May 2001 and are currently not working. Failures in the two redundant Sides make STIS unusable. While it is possible that further investigation will point out a way to restore STIS to a useful state, we believe it unlikely that STIS can be revived without physical servicing. Fortunately, all other science instruments and the observatory itself continue to function normally. The observing programs that use the unique capabilities of STIS will be suspended. We expect to notify all STIS observers about the status of their programs within the next several weeks. Date: Fri, 13 Aug 2004
Fundamental Goals of Abundance Studies • Galactic Disk:Assume a total abundance, based on stellar abundances, and then determine what proportions of the atoms are in the gas and solid (dust) phases. We characterize the loss of some element X from the gas phase by the depletion [X/H], defined by the relationship Sometimes called D(X) Reference Abundance
Fundamental Goals of Abundance Studies • Galactic Disk:Assume a total abundance, based on stellar abundances, and then determine what proportions of the atoms are in the gas and solid (dust) phases. • Systems outside the disk of the Galaxy:Measure the relative abundances of different elements to understand better a system’s element production history. • Often, for either of the two options, we must recognize the possible influence of one on the other, i.e., extragalactic systems have dust and fundamental abundances (gas + dust) may vary in the Galaxy
What has been Known for some Time • Depletions vary from one location to the next • Sightlines with low average density N(H)/d have less depletion • Gas at high velocity displacements have less depletion • Depletions vary from one element to the next • Depletion strengths are greater for elements that can form refractory compounds and are small for those that can only form volatile compounds
Kilian-Montenbruck, Gehren & Nissen “The galactic distribution of chemical elements as derived from B-stars in open clusters …” 1994: Astr. Ap., 291, 757: Compilation by Asplund, Grevesse, Sauval & Scott, 2009, ARAA, 47, 481 Classical Assumptions and some of their weaknesses Why is it that the heavy element abundances in the Sun (4.5 Gyr old) are generally higher than those in young B stars? • Reference standard for total element abundance ratios: • Solar & Meteoritic? • B stars? Abund Rel. to H × 106 ( needed to infer dust composition once the abundances of free atoms are determined)
A Study of ISM Gas-Phase Abundance Results in the Literature • Objective: Organize the information so that we can learn more about • Grain composition • How to correct for dust depletions in distant absorption line systems Survey scope: • 17 different elements • 243 sight lines • All results have been renormalized to a single compilation of f-values (Morton 2003). • This represents a massive bookkeeping and quality control effort.
A Study of ISM Gas-Phase Abundance Results in the Literature • Conventional Approach in Past Investigations: • Measure the depletion of a specific element and then characterize it in terms of some property of the sight line • Average density: N(H)/d • Fraction of hydrogen in molecular form
A Study of ISM Gas-Phase Abundance Results in the Literature • New Tactic: • Ignore the sightline properties and characterize depletions of elements with respect to each other, recognizing that the severity of depletions differ from one element to the next and from one region of space to the next.
Characteristics of the Survey Used in the analysis Not used in the analysis, but shows up in various plots
The Effects of Ionization [Si/H]total-[Si+/H0] [Fe/H]total-[X+/H0] Log U accept Log U accept Reject Reject Log N(H I) Log N(H I) From Meiring et al. (2009) arXiv:0905.4473
Underlying Strategy • Basic premise: • All elements deplete together in some systematic fashion, but by differing degrees that change from one region to another and from one element to the next. • Propose a single parameter, F*, that expresses a general level of depletion along a sight line. F* F* (F* is much like <n(H)> that has been used in the past.)
Underlying Strategy • Scale for F* is arbitrary; I chose a calibration as follows: • F* = 0 corresponds to lowest depletions seen (but subject to the restriction that N(H I) > 1019.5 cm-2). • F* = 1 corresponds to the depletion pattern observed toward ζ Oph F* F*
Underlying Strategy • Another basic premise: • Differences in how the elements respond to changes in F* are represented by other parameters specific to each element. F* F*
Basic Equation For element X: Depletion factor Slope: AX BX zx
The Buildup of Dust Grains Differential Element Contributions: Conventional Formula:
What about … … an “undepleted element?”
Well, no, not exactly But most people refer to Zn as a “relatively undepleted element” (i.e., compared to Fe or Cr), so perhaps we have not really been misled much.
Behavior for N(H I) < 1019.5 cm-2 Indicates that N(H I) < 1019.5 cm-2 Indicates that N(H I) > 1019.5 cm-2
Depletion Trends against Condensation Temperatures [Xgas/H]0
Distant Absorption Line Systems Basic Questions: • What is the pattern of intrinsic element abundances? • How does depletion onto dust grains affect this pattern? • The above two considerations lead to the measured column densities. Galaxy Background Quasar
Missing Information • What happens when I can’t measure N(H I) from the Lα feature of the system? • i.e., suppose I’m stuck with just a ground-based telescope and the system has z < 1.5. • How do I correct for dust depletion? • Can I estimate N(H I) modulo the metallicity? • OR … Suppose I can observe Lα, but I wish to determine both the effects of dust depletion and the overall metallicity of the system?
Recipe: Start with Depletion Data Log (X/H) +12 Recall the basic equation: Elem. X AX BX zX
Rearrange Terms in the Original Formulae Recall that for any element X, its depletion is given by [Xgas/H] = Log N(X) Log N(X) – Log N(H) Log N(H) –Log (X/H) –Log (X/H) = = BX BX + AX(F*–zX) + AXF* + AXF* – AXzX AXzX See tabulated values – + + F*AX Measured quantity Other stuff: see tabulated values y = a + b x But this correct only if the gas system has an overall metallicity that is solar, i.e., [M/H] = 0. If it’s subsolar, then the true N(H I) is higher. Then derive the coefficients of a least squares best-fit equation
Alternate Form [to use if you know N(H I) independently] Recall that for any element X, its depletion is given by = Log N(H)pred. from metals – LogN(H)obs. [Xgas/H] = Log N(X) Log N(X) – Log N(H) Log N(H) –Log (X/H) –Log (X/H) = = BX BX + AX(F*–zX) + AXF* + AXF* – AXzX See tabulated values – + [Xgas/H] BX AXzX + F*AX [M/H] Measured quantity Other stuff: see tabulated values y = a + b x Then derive the coefficients of a least squares best-fit equation
Now suppose that you can measure the Lα feature, and you find that Log N(H I) = 21.4. What is the sytem’smetallicity? y intercept: Log N(H) = 21.1 21 Mg Zn y = Log N(X) + stuff Slope: F* = 0.69 20 This is an oversimplification. In reality, one must consider errors in both x and y Also, an important requirement is that the values of AX must span a large enough range to define a good fit line. Cr Ti 19 -2 -1 0 x ( = AX)
How Well Does this Work? Compare the values of Log N(H I) Compare the values of F* Log N(H I) > 19.5 Log N(H I) < 19.5 F* From Best-fit Slope Derived Synthetic Log N(H I) Log N(H I) from Lα Original Value of F*
Warnings, Disclaimers, Caveats, and all that … • Suppose we start with an assumption that the general pattern of element abundances does not differ appreciably from that of our Galaxy, aside from a difference in the ratios relative to hydrogen. • After the best-fit line has been plotted, we see if there are any deviations that are significant (and make sense from a chemical evolution standpoint). • If there are, then we need to pause and think a little bit.
Warnings, Disclaimers, Caveats, and all that … • Here are some ideas: • From the earlier discussion of grain growth, one may think of AX representing element X’s proclivity to attach to dust grains and form compounds • Thus, AX is sort of a rate constant. • Starting with some different initial (intrinsic) element abundance pattern, one might be able to solve an integral equation that tracks the depletions of elements as the grains grow. However …
Warnings, Disclaimers, Caveats, and all that … Retention of atoms on grains after initial sticking may depend on the underlying composition of the seed material in the grain Most elements probably depend on the presence of others to form chemically stable compounds that are durable enough to remain in solid form for long periods of time. However …
Warnings, Disclaimers, Caveats, and all that … Example: 1. Most favorable means of depleting Ni & Ge uses Fe as a host element to form an alloy. Another Example: 2. Refractory silicate compounds that sequester Zn and Mn need Mg, Si & O to form the original host minerals.
Warnings, Disclaimers, Caveats, and all that … Another big However … The mix of primitive grains ejected from different kinds of sources (evolved stars, Type II and Ia supernovae, etc.) may differ from one galaxy to the next, depending on the IMF and star formation history. This could alter the pattern of compositions of the grain cores..
Calibration to Categories Defined by Sembach & Savage (1996) Halo: F* = –0.28 Disk + Halo: F* = –0.08 Warm Disk: F* = 0.12 Cool Disk: F* = 0.90
Application Examples Circumburst medium for GRB 020813 at z = 1.255 (Savaglio & Fall 2004) Cr Mn Ti Si Disk + Halo: F* = –0.08 y Fe Ni Zn N(H I) not measured because Lα could not be observed from the ground. But we do know this Mg x
Application Examples z = 2.08679 system toward Q1444+014 (Ledoux, Petitjean & Srianand 2003) This one of two strong components, separated by Δv = 12 km s-1; N(H I) not known for individual cases, so metallicity can not be determined Halo: F* = –0.28 Ti y Fe Mg Cr Zn N Ni P Si But once again, x
Application Examples z = 2.08692 system toward Q1444+014 (Ledoux, Petitjean & Srianand 2003) This is the other velocity component Zn P y N Fe “This is reminiscent of warm and cold Galactic disc cloud dust-depletion patterns …” (for this one particular velocity component) Si Ignore Warm Disk: F* = 0.12 Cool Disk: F* = 0.90 x
Application Examples z = 2.08692 system toward Q1444+014 (Ledoux, Petitjean & Srianand 2003) This is the other velocity component Zn y N Fe P Si Ignore Cool Disk: F* = 0.90 x