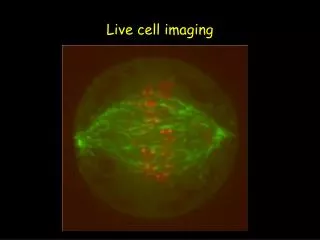
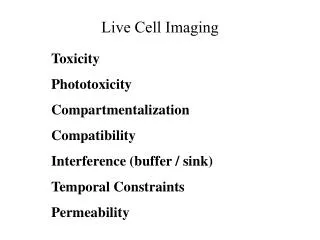
Live Cell Imaging
Live Cell Imaging. Toxicity Phototoxicity Compartmentalization Compatibility Interference (buffer / sink) Temporal Constraints Permeability. Permeability. 1. Endocytosis 2. Injection / infusion 3. Esterification acetate acetoxymethyl (AM). Ion Selective Dyes.

Live Cell Imaging
E N D
Presentation Transcript
Live Cell Imaging Toxicity Phototoxicity Compartmentalization Compatibility Interference (buffer / sink) Temporal Constraints Permeability
Permeability 1. Endocytosis 2. Injection / infusion 3. Esterification acetate acetoxymethyl (AM)
Ion Selective Dyes Calcium / Magnesium / Zinc ions Protons (pH) Sodium & Potassium ions Chloride / Halide ions
Ion Selective Dyes Magnesium Green (APTRA) 5-carboxy-2’,7’-chlorofluorescein Sodium Green (diaza crown ether) Calcium Green (BAPTA) 1,2-bis(o-aminophenoxy)ethane-N,N,N',N'-tetraacetic acid
Ion Selective Dyes Spectral compatibility Stoichiometry Specificity Affinity (KD) Dynamic range Permeability Optical response
Optical Response • 1. Change (+/-) in Quantum Yield with little change in spectra • e.g., fluo-3, Calcium Green, SPQ • 2. Blue shift of absorption (excitation) spectrum with little change in maximum emission • e.g., fura-2, Fura Red, SBFI, PBFI, BCECF • Blue shift in both absorption and emission spectra • e.g., indo-1, SNARF & SNAFL
Calcium Dyes - Issues Qualitative vs quantitative (calibration) KD for calcium Compartmentalization pH effects Interaction with other ions
Fluo Dyes Fluo 4
Optical Response • 1. Change (+/-) in Quantum Yield with little change in spectra • e.g., fluo-3, Calcium Green, SPQ • 2. Blue shift of absorption (excitation) spectrum with little change in maximum emission • e.g., fura-2, Fura Red, SBFI, PBFI, BCECF • Blue shift in both absorption and emission spectra • e.g., indo-1, SNARF & SNAFL
Fura-2 & Indo-1 Fura-2 Indo-1
Fura-2 Isosbestic point
H. Ma et al., Science 287, 1647 -1651 (2000) Published by AAAS
No Caption Found M. A. Takasu et al., Science 295, 491 -495 (2002) Published by AAAS
Optical Response • 1. Change (+/-) in Quantum Yield with little change in spectra • e.g., fluo-3, Calcium Green, SPQ • 2. Blue shift of absorption (excitation) spectrum with little change in maximum emission • e.g., fura-2, Fura Red, SBFI, PBFI, BCECF • Blue shift in both absorption and emission spectra • e.g., indo-1, SNARF & SNAFL
Fura-2 & Indo-1 Fura-2 Indo-1
Indicator Kdin vitro * Kdin situ Cell/Tissue Type fluo-3 390 nM 2570 nM Frog skeletal muscle fura-2 145 nM 371 nM U373-MG astrocytoma cell fura-2 145 nM 350 nM Rabbit gastric gland indo-1 230 nM 844 nM Rabbit cardiac myocyte Calcium indicators - affinity Table 20.8 Comparison of in vitro and in situ Kd values for fluo-3, fura-2 and indo-1.
Photo-activated “Caged” compounds GABA ATP uncaging requires violet - UV irradiation
Red calcium indicators Rhod-2 X-rhod-1
Rhod-2 & X-Rhod-1 Rhod-2 X-Rhod-1
Red calcium indicators Fura Red Calcium Orange
More Furas fura-5F fura-4F fura-FF fura-6F
Other Ratiometric Dyes Quin-2AM benzothiaza-1
Ion Selective Dyes Calcium / Magnesium / Zinc ions Protons (pH) Sodium & Potassium ions Chloride / Halide ions
Permeability of pH-sensitive dyes 1) calcein AM 2) BCECF AM 3) TFFDA 4) FDA 5) HFFDA 6) CFDA 7) CMFDA
SNARF & SNAFL Carboxy-SNAFL-1 AM SemiNAphthoRhodaFluors& SemiNAphthoFLuoresceins
Indo / SNARF-1 Fluorescence from the dual-emission Ca2+ indicator, indo-1 AM, is shown at 405 and 475 nm (left panels). Fluorescence from the dual-emission pH indicator, SNARF-1 AM, is shown at 575 and 640 nm (right panels)
Applications of pH selective dyes • Multidrug resistance • Cell volume changes • Cytosolic pH regulation in osteoblasts and osteoclasts • pH in lateral intercellular spaces of epithelial cell monolayers and interstitial spaces of normal and neoplastic tissue • Phagocytosis • Cl–/HCO3– exchange • K+/H+ exchange • Lactate transport and metabolism • Na+/H+ exchange • Na+/Ca2+ exchange • NH4+ transport • Apoptosis • Cytotoxicity
Reactive Dyes Chloromethyl-SNARF-1
Reactive Dyes Chloromethylfluorescein Diacetate
Ion Selective Dyes Calcium / Magnesium / Zinc ions Protons (pH) Sodium & Potassium ions Chloride / Halide ions
Sodium & Potassium Selective Dyes PBFI SBFI benzofuranyl fluorophores