Download

1 / 22
220 likes | 312 Vues
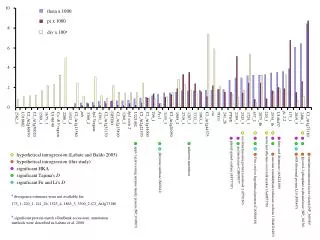
This study focuses on introgression mapping in Lolium perenne and Festuca pratensis grasses to create substitution lines and map traits to specific chromosomes using genetic and physical mapping. The genomic data includes genetic distances, physical distances, and BAC mapping details.

E N D
Introgression mapping in the grasses Lolium perenne and Festuca pratensis Julie King
LpLpLpLp x FpFp (28) (14) LpLpFp x LpLp (21) (14) BC1 (14) Production of substitution lines
Chromosome 1 Chromosome 5 Chromosome 2 Chromosome 6 Chromosome 3 Chromosome 7 Chromosome 4
LpLpLpLp x FpFp (28) (14) LpLpFp x LpLp (21) (14) LpLp(Fp) x LpLp (13Lp+1Fp) (14) BC1 LpLp(Fp) (14) BC2 BC2 introgression population
Lolium/Festuca substitution lines Lolium 2n=2x=14 3 5 6 1 2 4 7 7 Lolium/Festuca substitutions 5 2 3 6 1 4 7
BC2 plants used for physical mapping 18 11 3/26 3 3/10 17 56 83 2/3 3/23 19 99 3/2 92 36 6
Genetic Distance Physical distance cM % 0 0 Genotype H37/M36(2),H37/M36(3), E32/M40(3), . H43/M40(5), H43/M40(3),H36/M36(2), 7.9 7.1 18 H44/M39(5), E32/M40(4) E33/M41(1), 14.8 11.4 11 H42/M35(1). 25 12.4 H36/M36(3),H35/M39(2), H38/M36(2), E32/M41(2),E38/M40(3), H32/M37(2), E36/M37(3). 3/26 H35/M42(1), E33/M37(3). 27.8 15.5 6 H38/M36(1),H35/M39(3), E34/M35(1), 17.9 32.7 3 H42/M35(2),H44/M39(1), E34/M33(2),. 19.7 3/10 34 H36/M37(3),H37/M33(2),H32/M37(1), H35/M42(3), E32/M41(1), E36/M43(3), H37/M36(1). 28.9 37.6 36 H41/M33(2),H43/M40(2),H36/M37(2),H39/M37(2), E38/M40(2),E38/M40(4), H31M40(1),H37/33(1), H43/M40(4), H36/M36(1) E33/M38(1),E36/M37(1), H43/M40(6), 17 56.0 38.0 H35/M41(2), E33/M37(7),E33/M37(6), H36/M33(2). 44.5 59.2 83 H35/M39(4), 47.3 59.2 92 Centromere 49.2 E39/M38(1),E40/M40(1), H33/M33(1),H35/M39(5), H38/M43(1),H44/M39(4),H44/M39(3), E36/M43(1) H41/M33(1),H33/M38(2),H39/M37(1), NOR 56.6 62.5 61.2 3/2 E38/M40(1),E32/M41(3),E40/M40(2), H43/M40(1), E36/46(4),E36/M46(1),E36/M43(4),E36/M37(5), E36/M37(2),E34/M33(1),E33/M41(2). 68.5 61.9 99 70.0 NOR H42/M35(3), E34/M32(2),E33/M37(5). 73.1 61.9 83 E39/M38(2),E40/M40(3), E38/M32(2), H35/M41(1), E39/M32(1),E39/M32(2), H35/M39(1). 64.2 80.0 19 66.2 82.0 E38/M32(1),E36/M46(3),E39/M32(3),E33/M38(2), 56 68.9 E33/M37(4). 82.4 3/23 H44/M39(2),H35/M42(2), E36/M43(2),E36/M46(2),E33/M37(2), 86.6 73.9 2/3 E36/M37(6),E34/M32(3),E33/M41(3), H31/M40(2), E39/M32(4), H33/M33(2),H37/M33(3),H36/M37(1), E39/M38(3), H33/M38(1),H42/M35(4),H36/M33(1), 80.9 100
Genetic Distance Physical distance cM % 0 0 Genotype 7.9 7.1 18 14.8 11.4 11 25 12.4 3/26 27.8 15.5 6 17.9 32.7 3 19.7 3/10 34 28.9 37.6 36 17 56.0 38.0 44.5 59.2 83 47.3 59.2 92 Centromere 49.2 NOR 56.6 62.5 61.2 3/2 68.5 61.9 99 70.0 NOR 73.1 61.9 83 64.2 80.0 19 66.2 82.0 56 68.9 82.4 3/23 86.6 73.9 2/3 80.9 100 RZ783, C112 C949 CDO345 C250, C122, WG889, BCD128 CDO455 R1928, PSR370, RZ382, PSR394, CDO920 R1613 CDO328 CDO466, C30
Rice chromosome 1: BAC No.BAC/PAC BAC/PAC coordinates 1 P0672D08 1 – 173,729 3 P0005A05 300,777 – 436,798 8 P0463F06 851,331 – 919,450 14 P0037C04 1,345,101 – 1,437,630 16 P0408F06 1,566,828 – 1,698,033 22 P0024G09 2,381,624 – 2,444,317 25 P0009G03 2,715,057 – 2,855,651 …
BAC 227 (PAC clone PO686E09) Festuca AATTCTGGTTCATGTGTTCCTGTCGACATTGAGTGGCCTCCTAGAAGAGCA Lolium (4n) AATTCTGGTTCATGTGTTCCTGTCGACATTGAGTGGCCTCCTAGAAGAGCA Lolium (2n) AATTCTGGTTCATGTGTTCCTGTCGACATTGAGTGGCCTCCTAGAAGAGCA CATCATCTGAACTTTAATGCACCATTTTCTATGAACATGGATACTAAATCTG CATCATCTGAACTTTAATGCACCATTTTCTATGAACATGGATACTAAATCTG CATCATCTGAACTTTAATGCACCATTTTCTATGAACATGGATACTAAATCTG GAGAGCTGTCAAATGACGGACTCAATGATGTCGATCCTTTTGCCGATTGGC GAGAGCTGTCAAATGACGGACTCAATGATGTTGATCCTTTTGCCGATTGGC GAGAGCTGTCAAATGACGGACTCAATGATGTTGATCCTTTTGCCGATTGGC
BAC mapping discrepancies BAC Subline 167 7 170 5 174 4 178 2 261 7 326 3 + 5
Genetic Distance Physical distance cM % Genotype 0 0 , 9% BACs 7.9 7.1 18 15.5% 14.8 11.4 11 25 12.4 3/26 27.8 15.5 6 17.9 32.7 3 3/10 34 19.7 28.9 37.6 36 . 17 56.0 38.0 44.5 59.2 83 82% BACs 47.3 59.2 92 64.5% Centromere 49.2 NOR 56.6 62.5 61.2 3/2 68.5 61.9 99 70.0 NOR 73.1 61.9 83 80.0 64.2 19 66.2 82.0 56 68.9 82.4 3/23 9% BACs 86.6 73.9 2/3 20% 80.9 100
Genetic Distance Physical distance cM % Genotype 0 0 , 7.9 7.1 18 14.8 11.4 11 25 12.4 3/26 27.8 15.5 6 17.9 32.7 3 3/10 34 19.7 28.9 37.6 36 35% recombination = very low 50% BACs 47% genes 53% = T + H . 17 56.0 38.0 44.5 59.2 83 47.3 59.2 92 Centromere 49.2 NOR 56.6 62.5 61.2 3/2 68.5 61.9 99 70.0 NOR 73.1 61.9 83 80.0 64.2 19 66.2 82.0 56 68.9 82.4 3/23 86.6 73.9 2/3 80.9 100
Determining genetic control of target traits • Locate gene(s) controlling trait to chromosome(s) using substitution lines. • Locate gene(s) controlling trait to a particular bin using physical mapping population. • Use bin mapped rice BACs to exploit rice genome for further markers /candidate genes. • Springboard for gene isolation.
Nutrient use efficiency High nitrogen uptake - chr. 3 High nitrogen utilisation - chr. 4
All involved: Ian King Ian Armstead Iain Donnison Luned Roberts John Harper Kirsten Skot Lin Huang