Download
1 / 27
350 likes | 701 Vues
Gene Set Enrichment Analysis (GSEA). Gene expression analysis (Microarray & RNA-seq). Condition A (untreated). Condition B treated. Gene expression matrix. k. genes (p). Typical results: biological relevance?. If we are lucky, some of the top genes mean something to us

E N D
Gene expression analysis (Microarray & RNA-seq) Condition A (untreated) Condition B treated Gene expression matrix k genes (p)
Typical results: biological relevance? If we are lucky, some of the top genes mean something to us But what if they don’t? And how what are the results for other genes with similar biological functions
Gene Set Enrichment Analysis (GSEA)? • Using prior knowledge about the genes to infer new information from a gene expression analysis experiment • Gene set: a set of genes! • All genes involved in a pathway are an example of a Gene Set • All genes corresponding to a Gene Ontology term are a Gene Set • All genes mentioned in a paper might form a Gene Set • The aim is to give one number (score or p-value) to a Gene Set as a whole • Are many genes in the pathway differentially expressed (up-regulated/down-regulated)? • Can we give a number (p-value) to the probability of observing these changes just by chance?
What is a pathway? • No clear definition • Metabolic pathways are series of chemical reactions occurring within a cell. These pathways describe enzymes and metabolites. • Extended to other biological processes, e.g. signalling pathways; gene regulatory networks; protein complexes • In all cases a pathway describes a biological function / process very specifically
Overview • Where to get gene sets: Pathway and Gene Set data resources • GO, KeGG, Wikipathways, MSigDB, etc • Self contained vs competitive tests • Examples
Gene Set data resources • The Gene Ontology (GO) database • http://www.geneontology.org/ • GO offers a relational/hierarchical database • Parent nodes: more general terms • Child nodes: more specific terms • At the end of the hierarchy there are genes/proteins • At the top there are 3 parent nodes: biological process, molecular function and cellular component • Example: we search the database for the term “inflammation”
The genes on our array that code for one of the 44 gene products would form the corresponding “inflammation” gene set
KEGG pathway database • KEGG = Kyoto Encyclopedia of Genes and Genomes • http://www.genome.jp/kegg/pathway.html • The pathway database gives far more detailed information than GO • Relationships between genes and gene products • But: this detailed information is only available for selected organisms and processes • Example: Adipocytokine signaling pathway
Wikipathways • http://www.wikipathways.org • A wikipedia for pathways • One can see and download pathways • But also edit and contribute pathways • The project is linked to the GenMAPP and Pathvisio analysis/visualisation tools
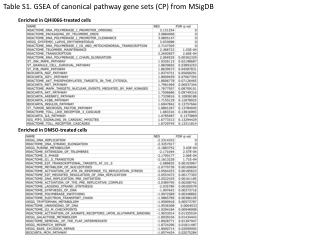
MSigDB • MSigDB = Molecular Signature Database • http://www.broadinstitute.org/gsea/msigdb • Related to the the analysis program GSEA • MSigDB offers gene sets based on various groupings • Pathways • GO terms • Chromosomal position,…
GSEA • Reminder: The aim is to give one number (score, p-value) to a Gene Set/Pathway • Are many genes in the pathway differentially expressed (up-regulated/down-regulated)? • Can we give a number (p-value) to the probability of observing these changes just by chance? • Similar to single gene analysis, statistical hypothesis testing methods are often used
General differences between analysis tools • Self contained vs competitive test • The distinction between “self-contained” and “competitive” methods goes back to Goeman and Buehlman (2007) • A self-contained method only uses the values for the genes of a gene set • The nullhypothesis here is: H = {“No genes in the Gene Set are differentially expressed”} • A competitive method compares the genes within the gene set with the other genes on the arrays • Here we test against H: {“The genes in the Gene Set are not more differentially expressed than other genes”}
Example: Analysis for the GO-Term “inflammatory response” (GO:0006954)
Using Bioconductor software we can find 96 probesets on the array corresponding to this term • 8 out of these have a p-value < 5% • How many significant genes would we expect by chance? • Depends on how we define “by chance”
The “self-contained” version • By chance (i.e. if it is NOT differentially expressed) a gene should be significant with a probability of 5% • We would expect 96 x 5% = 4.8 significant genes • Using the binomial distribution we can calculate the probability of observing 8 or more significant genes as p = 10.8%, i.e. not quite significant
The “competitive” version: • Overall 1272 out of 12639 genes are significant in this data set (10.1%) • If we randomly pick 96 genes we would expect 96 x 10.1% = 9.7 genes to be significant “by chance” • A p-value can be calculated based on the 2x2 table • Tests for asscociation: Chi-Square-Test or Fisher’s exact test P-value from Fisher’s exact test (one-sided): 73.3%, i.e very far from being significant
Competitive results depend highly on how many genes are on the array and previous filtering • On a small targeted array where all genes are changed, a competitive method might detect no differential Gene Sets at all • Competitive tests can also be used with small sample sizes, even for n=1 • BUT: The result gives no indication of whether it holds for a wider population of subjects, the p-value concerns a population of genes! • Competitive tests typically give less significant results than self-contained (see our example) • Fisher’s exact test (competitive) is probably the most widely used method!
Some general issues • Direction of change • In our example we didn’t differentiate between up or down-regulated genes • That can be achieved by repeating the analysis for p-values from one-sided test • Eg. we could find GO-Terms that are significantly up-regulated • With most software both approaches are possible • Multiple Testing • As we are testing many Gene Sets, we expect some significant findings “by chance” (false positives) • Controlling the false discovery rate is tricky: The gene sets do overlap, so they will not be independent! • Even more tricky in GO analysis where certain GO terms are subset of others • The Bonferroni-Method is most conservative, but always works!
Dependence between genes • All tests we discussed so far assumed that genes within the gene set are statistically independent • That is highly unlikely! • If genes are correlated the p-values of the gene set tests (eg. Fisher’s exact test) will be incorrect • This can be addressed by resampling methods • Reshuffle the group labels (Condition A vs. B) • Repeat analysis • Compare reshuffled with observed data • Note: reshuffling the genes does not solve the problem!
Gene Set Enrichment Analysis (GSEA) • http://www.broadinstitute.org/gsea/index.jsp • GSEA allows to analyse any kind of gene set: pathways, GO terms, etc… • It is available as a standalone program, but there are also versions of GSEA available within R/Bioconductor • GSEA has many options and is a mix of a competitive and self-contained method • The main idea is to use a Kolmogorov Smirnov-type statistic to test the distribution of the gene set in the ranked gene list (competitive) • Typically that statistic (“enrichment score”) is tested by permuting/reshuffling the group labels (self-contained)