Enrichment Map GSEA Tutorial
Enrichment Map GSEA Tutorial. Charu Gupta Kumar. Powerpoint by Casey Hanson. Exercise. In this exercise we will be doing the following:

Enrichment Map GSEA Tutorial
E N D
Presentation Transcript
Enrichment Map GSEA Tutorial CharuGupta Kumar Powerpointby Casey Hanson Enrichment Map GSEA Tutorial v1 | Charu Gupta Kumar
Exercise In this exercise we will be doing the following: • Conducting GSEA on a set of genes probed in Estrogen Treated (ES) human cells and Not Estrogen Treated (NT) cells at the 12 hr, 24 hr, and 48 hr mark. • Visualizing the result of running GSEA on our dataset against GO Pathway gene sets using the EnrichmentMap plugin for Cytoscape. Enrichment Map GSEA Tutorial v1 | Charu Gupta Kumar
Step 0: Shared Desktop Directory For viewing and manipulating files on the classroom computers, we provide a shared directory in the following folderon the desktop: classes/mayo In today’s lab, we will be using the following folder in the shared directory: classes/mayo/gupta Enrichment Map GSEA Tutorial v1 | Charu Gupta Kumar
Gene Set Enrichment Analysis In this exercise, we will perform a Gene Set Enrichment Analysis (GSEA) on gene expression (microarray) data in humans. The phenotypes of interest are cell lines that were treated with estrogen (ES) and not treated with estrogen (NT) at certain time points. We will use GSEA, to find out which GO Pathways our dataset is significantly enriched in. We will conduct the analysis at the 12 hr and 24 hr marks Enrichment Map GSEA Tutorial v1 | Charu Gupta Kumar
Dataset Characteristics I Enrichment Map GSEA Tutorial v1 | Charu Gupta Kumar
Dataset Characteristics II An excerpt of the gene expression data given MCF_ExpMX_v2.names.gct is shown below: Treated With Estrogen @ 12 Hours genes Enrichment Map GSEA Tutorial v1 | Charu Gupta Kumar
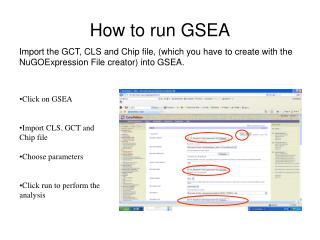
Step 1A: Starting the GSEA Tool In this step, we will start GSEA and load our necessary data. Double click the gsea2-2.0.jar icon on the Desktop. Click the Load data button. On the next page, select Browse for files. Enrichment Map GSEA Tutorial v1 | Charu Gupta Kumar
Step 1B: Starting the GSEA Tool In the file browser, navigate to our shared directory at classes/mayo/gupta/. Select the .cls, .gct, and .gmtfiles and hit Open. Wait for the confirmation window to pop-open indicating it loaded and hit OK. Enrichment Map GSEA Tutorial v1 | Charu Gupta Kumar
Step 2A : Configure GSEA to Run In this step, we will start our GSEA runs. Select Run GSEA from the Steps Pane On the resulting page, select MCF7_ExprMx_V2_names for our expression dataset. Enrichment Map GSEA Tutorial v1 | Charu Gupta Kumar
Step 2B: Configure GSEA to Run For Gene sets database, click the button adjacent to the textbox. On the pop-up window select the Gene Matrix (local gmx/gmt) tab. Select the GO .gmtfile and click OK. Enrichment Map GSEA Tutorial v1 | Charu Gupta Kumar
Step 2C: Configure GSEA to Run For Phenotype labels, click the button adjacent to the textbox. On the pop-up window select the ES_NT.clsas the source file. In the window, select ES12_versus_NT12 and click OK. We will run our analysis on the 12hr time point first between Estrogen Treated (ES) and Not Treated (NT) conditions. Enrichment Map GSEA Tutorial v1 | Charu Gupta Kumar
Step 2D: Configure GSEA to Run For Collapse dataset to gene symbols select false. For Permutation type select gene set. Click Show adjacent to the Basic fields header. Enrichment Map GSEA Tutorial v1 | Charu Gupta Kumar
Step 2E: Configure GSEA to Run For the analysis name, type the following: estrogen_treatment_12hr_gsea_enrichment_results Enrichment Map GSEA Tutorial v1 | Charu Gupta Kumar
Step 2F: Configure GSEA to Run Adjacent to the Save Results in this folder textbox, click: In the popup window, navigate to the Desktop and create a folder by clicking: Name the folder the following: estrogen_treatment_12hr_gsea Click the Select button. Enrichment Map GSEA Tutorial v1 | Charu Gupta Kumar
Step 3: Running GSEA At the bottom of the GSEA window click the Run button. Unfortunately this will take a while … Finished runs for this exercise are located in the following directory: mayo/gupta/results/ Enrichment Map GSEA Tutorial v1 | Charu Gupta Kumar
Step 3B: Re-running GSEA Perform the same analysis comparing the 24 hr time points. To do this, change our Phenotype Labels to ES24-NT24 Change the Analysis Name under Basic Fields to the following: estrogen_treatment_12hr_gsea_enrichment_results Select a new output folder on the desktop called the following: estrogen_treatment_24hr_gsea Click Run Enrichment Map GSEA Tutorial v1 | Charu Gupta Kumar
Cytoscape GSEA Visualization In this exercise, we will visualize and interpret the results of our GSEA analysis between ES and NT at 12 hrand 24 hrin Cytoscape. Enrichment Map GSEA Tutorial v1 | Charu Gupta Kumar
Step 4: Open Cytoscape 2.8.2 Double click the Cytoscape 2.8.2 icon Enrichment Map GSEA Tutorial v1 | Charu Gupta Kumar
Step 5A: Install Enrichment Map Plugin for Cyotoscape 2.8.2 Open the following link in a web browser: http://www.baderlab.org/Software/EnrichmentMap?action=AttachFile&do=view&target=EnrichmentMapPlugin_v1.2.zip Download EnrichmentMapPlugin_v1.2.zip to the Desktop. Extract the contents of the zip file to the Desktop. You should have README.txt, LICENSE.txt, and EnrichmentMap.jar files on the Desktop now. Enrichment Map GSEA Tutorial v1 | Charu Gupta Kumar
Step 5A: Install Enrichment Map Plugin for Cyotoscape 2.8.2 On the Menu Bar, click Plugins. Then click Install Plugin from File. In the pop window, navigate to the EnrichmentMapPlugin_v1.2 directory on the Desktop. Select EnrichmentMap.jar Click open. Enrichment Map GSEA Tutorial v1 | Charu Gupta Kumar
Step 5A: Configure the GSEA Plugin To load the GSEA Plugin for Cytoscape, click Plugin from the Menu Bar. Under Plugin, select Enrichment Map and Load Enrichment Results. Enrichment Map GSEA Tutorial v1 | Charu Gupta Kumar
Step 5B: Configuring the GSEA Plugin Under Analysis, select GSEA. We will load our results of GSEA on the 12hr data. Click the button adjacent to the Expression textbox underneath the Dataset 1 header. Enrichment Map GSEA Tutorial v1 | Charu Gupta Kumar
Step 5C: Configuring the GSEA Plugin In the pop up box, navigate to the your output directoryfor the 12 hr. run: estrogen_treatment_12hr_gsea Identify the RPT file (shown) Click Open Enrichment Map GSEA Tutorial v1 | Charu Gupta Kumar
Step 5C: Configuring the GSEA Plugin Set the P-value cutoff to 0.01 Set the Q-valuecutoff to 0.05 Set the Overlap Coefficient Cutoff to 0.05. Click Build. Enrichment Map GSEA Tutorial v1 | Charu Gupta Kumar
Step 6: Analyzing GSEA Visualization The resulting browser view should look similar to the bottom screenshot. Enrichment Map GSEA Tutorial v1 | Charu Gupta Kumar
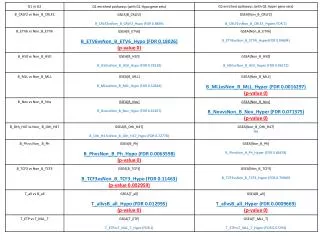
Step 7: Cytoscape Legend Nodes indicate GO Pathway Gene Sets. The color of the Node indicates what phenotype that GO term is most enriched in (Green/Red = ES, Blue = NT). The size of the nodes indicate how many genes are contained within the nodes. Edges associate those GO terms with genes in common. Enrichment Map GSEA Tutorial v1 | Charu Gupta Kumar
Step 8A: Results GO terms enriched in ES share many genes in common. The same applies to those GO terms enriched in NT. Obvious, but important result. Indicates the GSEA is working appropriately. Enrichment Map GSEA Tutorial v1 | Charu Gupta Kumar
Step 8B: Results Looking at the bottom cluster, there appears to be a cluster of related GO terms significantly enriched in the ES dataset and that share many common genes. Enrichment Map GSEA Tutorial v1 | Charu Gupta Kumar