Download
1 / 34
340 likes | 362 Vues
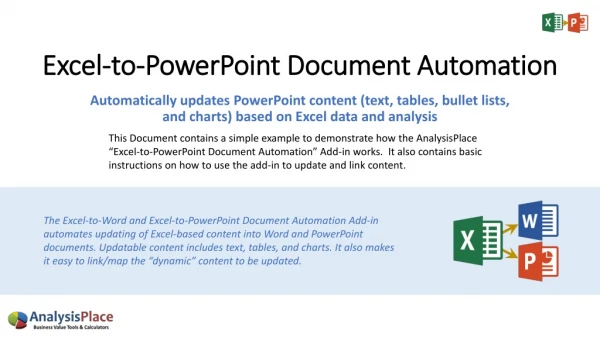
Automate the creation and updating of Word and PowerPoint content based on Excel data. This document demonstrates the advanced features and provides a how-to guide.

E N D
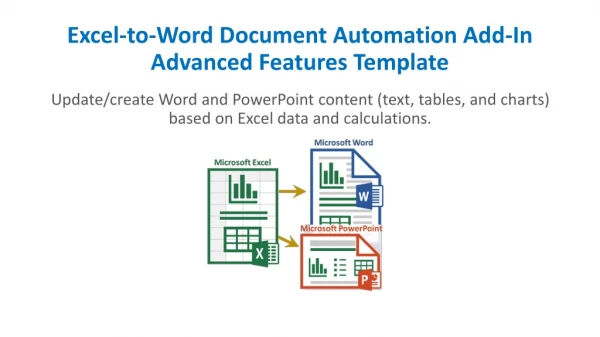
Excel-to-Word Document Automation Add-InAdvanced Features Template Update/create Word and PowerPoint content (text, tables, and charts) based on Excel data and calculations.
Advanced Features Template and How-To GuideThis document demonstrates select “advanced” capabilities of the add-in • This document along with the “AnalysisPlace Advanced Features.xlsx” workbook shows how the add-in can enable a variety of advanced data-focused document automation scenarios. • To use this document: • Activate the add-in in the “AnalysisPlace Advanced Features.xlsx” workbook and in this document. • Make changes to any of the tan input cells in the workbook in one or more of the desired worksheets • “Submit Content” in the workbook add-in • “Update Document”, then “Download” in the add-in in this document. You should be able to see the changes, based on your Excel modifications • You are welcome to modify and use the content in these documents for your own use. • If you are not already familiar with the basic features of the add-in, first see: See https://analysisplace.com/Document-Automation/Get-Started
How to Link/Map ContentMapping content between Excel and PowerPoint is easy, but does require some manual steps In Excel • Name Content (cell, range, or chart) • “Submit” Content In PowerPoint • Click “Get Excel Source Data” (“Link” tab) In PowerPoint (for each item/shape) • Select desired Excel source from the drop-downs • Copy the provided {code}, including the brackets • Select (or create) the desired shape Important: the shape type must match: Text - Shape can be a title, text box, content shape, WordArt, etc. Images - Shape must be an existing image/picture. For example, copy the chart image or range image from Excel, then paste it in PPT as a picture (TIFF on a Mac). Don't paste chart as the default chart format. With PPT Online: Insert > any Picture or Online Picture. Charts – Shape must be an existing chart. You can paste a chart from Excel or Insert > Illustrations > Chart Tables - Shape must be an existing table. You can paste from Excel or Insert > Table • Paste {code} into the Shape's “Alt Text” description box Windows or Mac: Right-click on shape border, choose "Edit Alt Text". Online: Select shape > Click the Shape In PowerPoint (to update your document) • On the "Update" tab, click "Update Document". This will upload a copy of your PowerPoint document along with your changes/data from Excel. Our server will then modify the document. • Download your updated document via the “Download” button 6 3 7 4 5
Text Excel-sourced text can be incorporated into documents in a variety of ways. Single-cell named ranges update text items (e.g. titles, paragraphs, parts of text, lists) in Word/PowerPoint. Add Text to Various Document Content Types Linked text can include or can be within: paragraphs, titles, text boxes, most shapes, WordArt, headers/footers, or a table cell. You can style the text as desired (colors, bold, font, etc.) and the style will remain after the update. Customer XYZ • This example shows the name of your customer: • Combining Text and Data • Data can easily be combined with text using the text() formula in Excel: Customer XYZ will save $900,000.
Text - Bullet Lists • The add-in can create lists that change based on formulas in Excel. List are based formulas in a single cell. • Lists from Excel (a single link/control) can be styled as bullets or numbered lists. • Alt-enter is typically used for manually created lists (in Excel). • Char(10) is used if you want to list to change dynamically (part of a formula). • This example shows a dynamically created (based on an Excel formula) bullet list: • Customer XYZ will save $900,000. Payment must be received by March 07, 2019. Customer will be happy.
Text - Paragraphs This example shows dynamically created (Excel-sourced) paragraphs: Lorem ipsum dolor sit amet, ei cum apeirian voluptaria. Lorem debitis liberavisse ex cum, fugit consulatu consequuntur eam eu. Te sea oratio utinam qualisque, inani numquam eruditi quo ei. Choro fierent cu eos, ex omnis eruditi nec. Graece consetetur consectetuer qui an. Ut ludus omittam mea, eu has harum cotidieque, te per libris minimum rationibus. Dolore vituperata honestatis vim ei, erat decore blandit ea usu. Vero invenire eos ne, duo ea oporteat scribentur, essent volutpat eum ei. Ex eos ceteros invenire, timeam omnesque constituam ut mea. Cum integre epicurei comprehensam et, an cum iudico nominati interesset. Cu nam sanctus laoreet, ad ignota tibique tacimates eum. Quas nonumes fuisset te pro, mei ad dolores vivendum, vim ei tantas dolorem. Id mentitum qualisque sit. Id mel quot delectus. Tibique perpetua vix te, vim assum senserit cu. At his quis sumo simul, apeirian forensibus eam ut. At sale repudiandae mel, vis cu ullum placerat iracundia. In vis quis labores apeirian, liber tempor qui cu, sea ut graeci instructior consectetuer. Ex ius posse vivendo. Ea per quod scripta. Lucilius lobortis ei quo, ei zril maiestatis percipitur vel. Iudico suscipit sit te, patrioque deseruisse mnesarchum pri no, sea cu movet labitur accusam. Est homero apeirian concludaturque et.
Tables The add-in was designed to update Word/PowerPoint tables for a variety of scenarios, including updating of large/complex tables, such as financial reports. This section describes/demos key table features. Also see the companion workbook for Excel-specific instructions. Named Ranges Vs. Data Tables • Source Excel data can be based on named ranges or tables (data tables). They both can update Word/PowerPoint tables the same way. The first and third tables on the following slides are based on named ranges; the second is based on an Excel table. Create and Format Tables In PowerPoint, you can link tables in 3 ways (first Add-in > Link > “Get Excel Source Data” > Select your table source from the drop-downs): • Insert a new table: (Ribbon > Insert > Tables > Table); format the table (Ribbon > Table Tools > Design); select the entire table by clicking the table border; then link the table (Add-in > Link > “Insert Content / Update Link”). • Link an existing table: The table should have the same number of rows/columns as the source Excel table/range. • Copy/Paste a table from Excel: paste as either source or destination format. You can then change the format (e.g. add cell margins). You can style tables (Table Styles, borders, font, colors, etc.) and the style will remain after the update (only the text will update).
Tables Automatic Table Resizing (Insert/Delete Rows/Columns) • The add-in will try to resize Word/PowerPoint tables to match the size of the source Excel table/range. For example, if the Excel table has 7 rows and the Word table has 4, the add-in will insert 3 rows. The next-to-the-last row/column will be used for the format template for the inserted rows/columns. Table Merged Cells • The add-in supports most Word/PowerPoint table merged cell scenarios. The table below contains 2 merged cell areas in the 1st row.
Tables • Disable Specific Table Cell Changes • To avoid updating individual table cells in Word/PowerPoint tables: In the desired table cell in Excel, enter a "!~" (without the quotes) at the start of your cell text/formula. Or use UNICHAR(8205) at the start of your formula (which is an invisible character). The Word/PowerPoint add-in will not update cells if the source cell text from Excel starts with those characters. • This is useful to avoid updating content that will never change or if you have cells with mixed formatting that you do not want to be replaced. • It is also useful for multi-lingual reports/outputs -- if you have a single Excel workbook/tool and multiple output reports (one for each language). This will enable you to update the numbers in Word/PowerPoint tables without overwriting the text (e.g. row/column headers) in the cells. For cells that contain mixed numbers and text, you could add the multi-lingual text to formulas based on lookups. • Hide Table Rows • To include visible rows/columns only: in Excel, add the suffix "_visible" (or "_vis") before the range or table name. Hidden, filtered, or grouped rows will not appear in your Word/PowerPoint table. Can be combined with _body. • The table below demonstrates this – it only includes visible rows in the source Excel table. The table is resized to match the Excel table visible row and column counts.
Tables Simple Financial Statement Example This example demonstrates that the destination content appearance can be very different from the source Excel format.
Images of Ranges • This feature transfers the image (PNG) of the named range, just as it looks in Excel. • Name the cell or range of cells (starting with the prefix and ending with "_img"). Include any content in the range (conditional formatting, sparklines, images, shapes, text boxes, smart art, dynamic items, etc.) The image (PNG) of all content in the range will be transferred to your Word/Ppt document just the way it appears in Excel. • Some users choose to transfer images of tables instead of updating text within each cell. This may be easier than formatting tables in Word/PowerPoint, however, it will significantly increase transfer size and will make the Word/PowerPoint file much larger. • Note: Currently, this is only compatible with Office for Windows. It is not yet compatible with Macs. In Office Online, it only transfers content within the range (including conditional formatting), but not items added on top of the range (such as images). However, the same result can be achieved by putting the content on a chart (works on Macs).
Images of Ranges Image based on range containing a variety of formula-based elements This example shows sparklines, conditional formatting, and a chart in a range. The source of the image below is a named range in Excel.
Images of Ranges Image based on user selection or cell formula • The example below displays a flag image based on a country that is selected based on a drop-down list in Excel. It shows an image which appears in a single cell in Excel. • This technique is commonly used to display product images based on selected/configured solution or people photos. Andorra Depending on your needs, there are also many ways to use VBA macros (and other add-ins) to modify the image displayed in the cell (which can be updated in Word/PowerPoint). Images could also be based on a URL from a remote web site.
Image of Charts / Graphs When charts are submitted, the chart image (PNG) will be transferred to your Word/PowerPoint document. So format them in Excel the way you want them to look in your document. You can use essentially any type of chart/graph. • You can change the image size and resolution. Higher resolution charts appear sharper in Word/PPT, but also increase transfer size and Word/PowerPoint file size. • To Resize Chart Images: append your chart name with '_h' then the desired height in pixels or '_w' and the desired width in pixels. For example, 'rpt_Chart_w250' creates the image so it is 250 pixels wide (8.8 cm / 3.5 inches). The non-specified dimension scales so the aspect ratio remains the same. • In Word, you can constrain the image size by placing the image within a container, such as a text box or a table with the cell Auto-Fit set to "Fixed Column Width". If you don’t constrain it, by default, its size in Word/PowerPoint will be the same as its size in Excel. The image is within a text box to control the image size. Image Size, Quality, and Resolution
Image of Charts / Graphs Charts with Added Content • You can include other content to your charts, such as dynamic text, images, shapes, etc. • This feature can enable very powerful/flexible content automation capabilities. • The chart below contains formula-based text and an image which will update based on the growth rate:
Conditional Sections (Document Assembly) Control what sections to include in created reports (by removing un-needed sections) • AnalysisPlace can not perform "Document Assembly" per say, but it can do the equivalent: It can automatically delete un-needed sections from the template. So include all needed content in your Word or PowerPoint templates, then configure your workbook to automatically indicate (e.g. based on formulas) which sections to delete, depending on the user scenario. • In Excel, The "ReportSectionsToDelete" table (if it exists), determines which sections of created Word or PowerPoint reports will be deleted when updated on the server. See “AnalysisPlace Advanced Features.xlsx” for instructions. • In PowerPoint, sections are individual slides • Enter the "Section Name" in the Notes (View > Show > Notes) (under the slide) in curly braces, e.g.: {SectionName}. It is only necessary to do this on slides that are to be removed in some scenarios. • A single slide can contain multiple section names: {Appendix}{CostAnalysis}. A section name can be included on multiple slides. The section name can be combined with your note text. PowerPoint slide Notes indicate Section Names
Conditional Sections (Document Assembly) Control what sections to include in created reports (by removing un-needed sections) This slide will be deleted if Scenario A or B is selected in the drop-down on worksheet “Conditional Sections” (it contains “{SectionName}” in the notes) PowerPoint slide Notes indicate Section Names
Mail Merge • The add-in was not designed for high-volume automated mail merge and it should not be used as a replacement for Word’s native “Mailings” (Mail Merge) features. • The add-in can effectively be used to lookup recipient data from a list/table, calculate results, then update Word/PowerPoint templates. This enables rapid creation of personalized data-intensive documentation. However, unlike Mail Merge, the documents must be updated one at a time. • The example below looks up company data from an Excel table based on a drop-down list, calculates results, then updates text, a table, and a chart in Word/PowerPoint. This process would have to be repeated for each recipient. Based on our analysis, we believe Berkshire Hathaway could save $351 billion by purchasing our solution. Act today and you can purchase it for only $75 billion.
Localization - Currency • It is often important to be able to easily localize (currency and language) assessment tools and results documents. For example: • supporting users who are located in different regions • creating documents for customers located in other countries • Currency Switching (currency symbols and exchange rates) • This example shows how to change currency symbols and exchange rates (via a drop-down selection) in your Excel and destination documents. Your net benefit is expected to be ¥25,630
Localization - Language Language Switching The example below shows how to change language (via a drop-down selection) in your Excel and destination documents. It also changes currency. 私達の分析に基づいて、私達はあなたの会社が救うことができることを信じる ¥22,782億ドルのソリューションを購入しています。今日の行為は、あなただけのためにそれを購入することができます¥25,630億。
Layout Options Dynamic content can be incorporated in a variety of ways (not just in-line) enabling great-looking documents/presentations. PowerPoint • All PowerPoint content is shape-based. Shapes can be titles, text boxes, tables, images, etc. • Shapes are tagged (with the link code in the shape’s alt-text property) and updated by the add-in. Shapes can be placed anywhere on a slide (including overlapping). • A slide can contain many shapes. Slides and shapes can be copied/pasted and will retain their links. Word • The content controls can be placed in-line with text (the default) or you can insert the controls within containers, such as text boxes, and these containers can be placed anywhere (not just in-line with text). This enables very powerful/flexible layout options, such as updatable dashboards, infographics, and great-looking personalized branded marketing/sales material. Headers, Footers, and Master Slides • In PowerPoint, master slides can contain linked content. • In Word, linked text can be placed in headers and footers.
PowerPoint Chart Updating This document demonstrates how to update PowerPoint charts from Excel data using the AnalysisPlace Excel-to-Word Document Automation Add-in. It also includes chart examples. • The chart examples in this document can be updated from the “PowerPoint Chart Updating.xlsx” • Supported chart types: • Bar, line, pie, area, surface, radar, stock, scatter, and combo charts • Not yet supported: tree map, map, sunburst, funnel, histogram, waterfall, and box and whisker charts (let us know if you want them) • Updates chart values as well as category and series names • Formats ($, %) are not modified – set formats in the chart • Source Excel range (or Table) must be contiguous (single range) with the category names in the 1st column and series names in the 1st row. • Transposed data source • Normally series values go down rows and categories go across columns. The add-in usually is able to determine if data is transposed • Title text updating: the chart feature does not directly update other text items in the chart, but you can update text via a text box placed on top the chart • Excel source range can be re-sized: The update will add/remove # of items in Series and add/remove Categories* Example Excel Data Source Example Excel Range or Table Name: rpt_chartSourceData *Formatting often varies by Series (e.g. bar color), so start with a larger number of categories in your template
How to Link Charts • 2 Ways to Insert a Chart • Create the chart in Excel, then paste it into PowerPoint (you can “embed data” or “link data”) • Create the chart in PowerPoint (Insert > Illustrations > Chart) • Link the chart to a Range (or Table) in Excel • In Excel, name the source range/table (including category/series labels), then “Submit Content” • In the PPT add-in, click “Get Excel Source Data” • Select the desired “Table” source from the drop-downs • Display the Alt Text box by right-clicking on the charts border, select “Edit Alt Text” • Paste the {code} into the Chart’s Alt Text box 5 2 3 4
PowerPoint Shape Types Updates Updates PowerPoint Charts Updates Updates Updates • There are 2 ways to update PowerPoint charts: • Update chart images: • Requires large data transfer • Supports any chart type, including adding any content on top of chart, such as images, dynamic range, etc. • Update native chart data: • Very small transfer size; practical for PPT with many large charts
Chart Examples - Bar & Column Charts Excel Source: {Table:Charts!r_CommonCharts} Excel Source: {Table:Charts!r_CommonCharts} Excel Source: {Table:Charts!r_CommonCharts} Excel Source: {Table:Charts!r_CommonCharts}
Chart Examples - Transposed Charts Excel Source: {Table:Charts!r_CommonCharts} Excel Source: {Table:Charts!r_CommonCharts}
Chart Examples - Pie Charts Excel Source: {Table:Charts!r_PieCharts} Excel Source: {Table:Charts!r_PieCharts}
Chart Examples - Line & Area Charts Excel Source: {Table:Charts!r_CommonCharts} Excel Source: {Table:Charts!r_CommonCharts}
Chart Examples - Scatter Charts Excel Source: {Table:Charts!r_Scatter} Excel Source: {Table:Charts!r_Scatter2Series}
Chart Examples - Stock Charts Excel Source: {Table:Charts!r_StockChart}
Chart Examples - Combo Charts Excel Source: {Table:Charts!r_CommonCharts} Excel Source: {Table:Charts!r_CommonCharts}
Chart Examples - Surface & Radar Charts Excel Source: {Table:Charts!r_CommonCharts} Excel Source: {Table:Charts!r_CommonCharts}