Excel-to-PowerPoint Document Automation
140 likes | 172 Vues
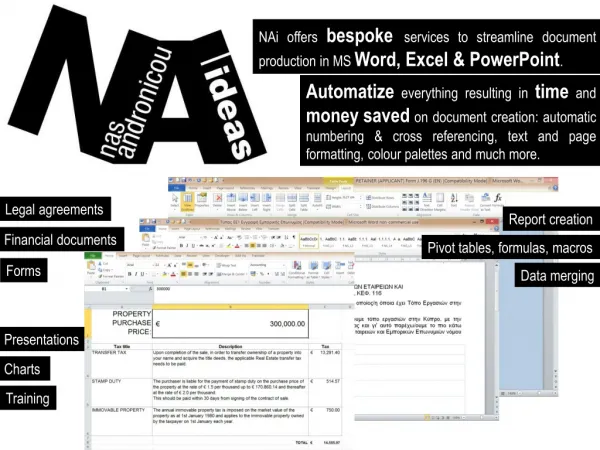
This document showcases the AnalysisPlace Excel-to-PowerPoint Document Automation Add-in, automating content updates from Excel to PowerPoint. Learn how to update text, tables, bullet lists, and charts effortlessly.

Excel-to-PowerPoint Document Automation
E N D
Presentation Transcript
Excel-to-PowerPoint Document Automation This Document contains a simple example to demonstrate how the AnalysisPlace “Excel-to-PowerPoint Document Automation” Add-in works. It also contains basic instructions on how to use the add-in to update and link content. Automatically updates PowerPoint content (text, tables, bullet lists, and charts) based on Excel data and analysis The Excel-to-Word and Excel-to-PowerPoint Document Automation Add-in automates updating of Excel-based content into Word and PowerPoint documents. Updatable content includes text, tables, and charts. It also makes it easy to link/map the “dynamic” content to be updated.
Sample Dynamic Content – Text & Images Content on these 4 slides will be updated based on the data submitted from Excel when you click “Update Document” on the add-in Update tab. Personalized for: This text will be updated based on the “rpt_CustomerName” cell in Excel This text will be updated based on “rpt_TextSummary” cell in Excel • Basic Features Advanced Features Management Module Support Services (5 Years) MyCustomer MyCustomer can realize $267,596 in benefits with an investment of only $111,558 -- that is an ROI of 140%. Features Included in Scope: When updated, this chart will match the appearance of the Excel chart named “rpt_CostsVsBenefitsChart” This bullet list will be updated based on the “rpt_ScopeList” cell in Excel
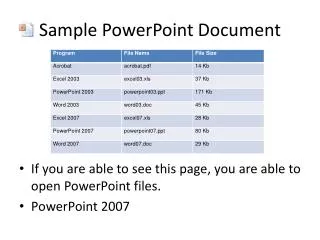
Sample Dynamic Content - Tables Table Updated from an Excel Named Range Table Updated from an Excel Table (Data Table) The text in this table will be updated based on the range named “rpt_ROISumTable” in Excel The text in this table will be updated based on the Table (data table) named “rpt_ExpensesTable_visible” in Excel
Sample Dynamic Content - Charts These charts will be updated based on the range named “rpt_ChartSource” in Excel
Sample Dynamic Content - Charts These charts will be updated based on the range named “rpt_ChartSource” in Excel See “Advanced Features” for other chart types
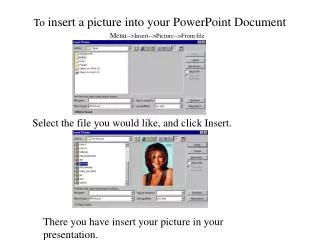
To Get StartedTo get started, update the sample PowerPoint document from the sample Excel workbook • Install the “Excel-to-Word Document Automation” Add-In in both Excel and PowerPoint (and Word, if desired) • Insert > Add-ins > Store • Search for “Document Automation”. Add it. • Activate it from the Home ribbon • “Insert Sample Content” and download PowerPoint templates (available from within the Excel add-in Start tab) • In Excel: modify some tan-colored input cells, then “Submit Content” (from the “Submit” tab of the add-in) • In PowerPoint: “Update Document” from the “Update” tab of the add-in • Download the updated document. You should see the changes. 1 2 D 3 E
How to Link/Map ContentMapping content between Excel and PowerPoint is easy, but does require some manual steps In Excel • Name Content (cell, range, or chart) • “Submit” Content In PowerPoint • Click “Get Excel Source Data” (“Link” tab) In PowerPoint (for each item/shape) • Select desired Excel source from the drop-downs • Copy the provided {code}, including the brackets • Select (or create) the desired shape Important: the shape type must match: Text - Shape can be a title, text box, content shape, WordArt, etc. Images - Shape must be an existing image/picture. For example, copy the chart image or range image from Excel, then paste it in PPT as a picture (TIFF on a Mac). Don't paste chart as the default chart format. With PPT Online: Insert > any Picture or Online Picture. Charts – Shape must be an existing chart. You can paste a chart from Excel or Insert > Illustrations > Chart Tables - Shape must be an existing table. You can paste from Excel or Insert > Table • Paste {code} into the Shape's “Alt Text” description box Windows or Mac: Right-click on shape border, choose "Edit Alt Text". Online: Select shape > Click the Shape In PowerPoint (to update your document) • On the "Update" tab, click "Update Document". This will upload a copy of your PowerPoint document along with your changes/data from Excel. Our server will then modify the document. • Download your updated document via the “Download” button 6 3 7 4 5
Common Document Automation ScenariosEnables a wide variety of data-intensive document automation scenarios. Here are a few:
Key Features • Easy/secure download and install via the Microsoft Office Store • One add-in for Excel, Word, and PowerPoint • Single Excel document can update both Word and PowerPoint files • Office for Mac and Office for Windows (Office Online can update only) • Free-forever versions available for evaluation and light use • Content links are durable • Content links between Excel and Word/PowerPoint are durable (can be shared with others and will still update properly) • Links are easy to maintain and update • Linked content can be copy/pasted into other documents
Word Vs. PowerPointKey Differences *Excel content is transferred to Word via a server, then content is updated in Word using the Add-In **Excel content along with a copy of the entire PPTX document is uploaded to the server where the PPTX is updated then the modified PPTX is downloaded back to the user
PowerPoint Shape Types Updates Updates Updates Updates Updates • There are 2 ways to update PowerPoint charts: • Update chart images: • Requires large data transfer • Supports any chart type, including adding any content on top of chart, such as images, dynamic range, etc. • Update native chart data: • Very small transfer size; practical for PPT with many large charts
PowerPoint Chart Updating This document demonstrates how to update PowerPoint charts from Excel data using the AnalysisPlace Excel-to-Word Document Automation Add-in. It also includes chart examples. • The chart examples in this document can be updated from the “PowerPoint Chart Updating.xlsx” • Supported chart types: • Bar, line, pie, area, surface, radar, stock, scatter, and combo charts • Not yet supported: tree map, map, sunburst, funnel, histogram, waterfall, and box and whisker charts (let us know if you want them) • Updates chart values as well as category and series names • Formats ($, %) are not modified – set formats in the chart • Source Excel range (or Table) must be contiguous (single range) with the category names in the 1st column and series names in the 1st row. • Transposed data source • Normally series values go down rows and categories go across columns. The add-in usually is able to determine if data is transposed • Title text updating: the chart feature does not directly update other text items in the chart, but you can update text via a text box placed on top the chart • Excel source range can be re-sized: The update will add/remove # of items in Series and add/remove Categories* Example Excel Data Source Example Excel Range or Table Name: rpt_chartSourceData *Formatting often varies by Series (e.g. bar color), so start with a larger number of categories in your template
How to Link Charts • 2 Ways to Insert a Chart • Create the chart in Excel, then paste it into PowerPoint (you can “embed data” or “link data”) • Create the chart in PowerPoint (Insert > Illustrations > Chart) • Link the chart to a Range (or Table) in Excel • In Excel, name the source range/table (including category/series labels), then “Submit Content” • In the PPT add-in, click “Get Excel Source Data” • Select the desired “Table” source from the drop-downs • Display the Alt Text box by right-clicking on the charts border, select “Edit Alt Text” • Paste the {code} into the Chart’s Alt Text box 5 2 3 4
For More Information https://analysisplace.com/Solutions/Document-Automation Also See Requirements This add-in requires Office 2016 (Office 365 subscription version) or newer. • Office 365 for Windows (subscription version): requires version 1705 (Build 8121.1000) or later. • Office 2016 for Windows (non-subscription): requires version 16.0.4678.1000 or later. Most Office 2016 installed versions are not compatible. • Office for Mac: requires version 15.34 or later (Office 365 subscription version). • Office 2019: all Windows and Mac versions are compatible. • Office Online, via OneDrive or SharePoint: compatible, but with some limitations. Support • Please contact AnalysisPlace for any questions, issues, or suggestions. • https://analysisplace.com/Contact-Us or use the feedback form in the add-in • Advanced Features • The add-in support a variety of other features. For example: Currency Switching, Multi-lingual Reports, Advanced Graphs, Automatic Table Resizing, Inserting HTML, Document Assembly, Conditional Submit, Table Merged Cells, Dynamic Lists and Paragraphs, Professional Word layouts, Mail Merge, etc. • https://analysisplace.com/Resources/Templates#Advanced Features • Enterprise Features • The add-in also supports capabilities that enable you to create, deploy, manage, and monitor Excel-based tools that are used by multiple users (including template-based report generation). • https://analysisplace.com/Document-Automation/Enterprise • API • Easy-to-configure template-based document creation service • https://analysisplace.com/document-automation/apis