Download
1 / 44
440 likes | 592 Vues
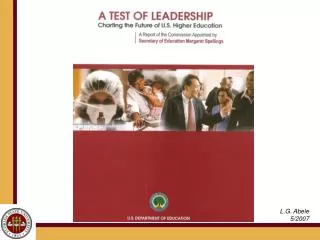
L.G. Abele 5/2007. Major Issues Behind the Spellings Commission. Escalating costs of higher education (affordability and accessibility) Low participation and graduation rates and shifting demographics (accessibility)

E N D
L.G. Abele 5/2007
Major Issues Behind the Spellings Commission • Escalating costs of higher education (affordability and accessibility) • Low participation and graduation rates and shifting demographics (accessibility) • Uncertainty of the “Value Added” of a College Education (accountability and quality)
The increase in college tuition and fees has outstripped price increases in other sectors of the economy. BUT 20-30% of the fees are A&S funds that provide student amenities.
State and Local Appropriations for Higher Education Institutions in Constant (2004) Dollars: Total Appropriations, Appropriations per Full-Time Equivalent (FTE) Student and Enrollments, 1980-81 to 2004-05 Source: The College Board, Trends in College Pricing, 2006
Distribution of Full-Time Undergraduates at Four-Year Institutions by Published Tuition and Fee Charges, 2006-07 Source: Annual Survey of Colleges, The College Board, New York, NY. Source: The College Board, Trends in College Pricing, 2006
Higher Education Institutions Graduation Rates
Graduation rates for college students OECD countries
The United States is still among the top nations in the proportion of older adults holding a college degree…but it drops to 7th in the educational attainment of young adults
Composition of the U.S. population, 2000 to 2050 Source: United States Census Bureau Other Asian Black Hispanic White, non-Hispanic
Levels of educational attainment, 2000 Source: United States Census Bureau At least 4 years of high school At least 4 years of college
Percentage of college graduates proficient in prose, document, and quantitative literacy: 1992 and 2003 Source: U.S. Department of Education, National Center for Education Statistics, 1992 National Adult Literacy Survey and 2003 National Assessment of Adult Literacy.
Major Recommendations of the Spellings Commission • Access • Cost and affordability • Financial Aid • Learning • Transparency and Accountability • Innovation
Voluntary System of Accountability Program (VSA) • NASULGC: National Association of State Universities and Land Grant Colleges • AASCU: American Association of State Colleges and Universities • AAU: Association of American Universities • Web forum: http://www.aascu.org/Community/forums/default.aspx?GroupID=7
Goals of VSA • Self Determination rather than Federal Regulation • Identify Key Elements of Accountability • Gather Consensus on Measures • Select a Range of Assessment Instruments • Identify Measures and Data to Report to the Public
VSA Committees • Broadly Representative of American Universities, Public and Private • Campus Engagement • Student-Family Information • Core Educational Outcomes • Learning Outcomes and Assessments: Focus on identifying a small number of educational outcome assessment instruments keeping in mind the requirement of facilitating comparison. • Growth Outcomes and Assessments: Focus on developing a list of student growth domains that institutions should assess and demonstrate value added.
Learning Outcomes and Assessment Instruments • CAAP: Collegiate Assessment of Academic Proficiency (ACT) • MAPP: Measure of Academic Proficiency and Progress (ETS) • CLA: Collegiate Learning Assessment (Council for Aid to Education) • C_Base: College Basic Academic Subjects Examination (U Missouri-Columbia)
Why is “Value Added” Verified by Testing? • Easily mapped to course content • Highly reliable • Relatively inexpensive • Yields both individual and institutional results • Is relatively unobtrusive • Yields comparative results (a strong recommendation of the commission)
Each assessment instrument has the benefit of: • Scaled Scores • Benchmarking • Trend Analysis • Criterion Referenced Scores may be included (defined as an established level of performance and the student either achieves that level or not)
Where to Begin—Focus on Student Learning “What does he know, and how long will he know it?”
Three Areas of Competence • General Education • Communication • Mathematics • Social Sciences • Humanities • Natural Sciences • Higher Level Skills • Critical Thinking • Analytical Reasoning • Problem Solving • Written Communication • Content in the Major* * (not addressed here)
COMMUNICATION Essay Skills Suitability to purpose Effectiveness English Language Word choice Sentence structure Reading Literal and critical comprehension COMPUTATION Arithmetic Geometry Algebra Statistics Logical reasoning What Skills Should be Measured?
Results of Skills Assessment(individual and institutional results of criterion-referenced test)
Assessment of Higher Level Skills • Evaluation of assessment instruments • Selected the CLA: The Collegiate Learning Assessment • The assessment focuses on higher level skills, yields measurable results and is not content specific.
Higher Level Skills Example: Performance Task
A sample of >200 universities Relationship Between CLA Performance and Incoming Academic Ability
value added = (B-A) Sr. Sr. Scores 4 years later Sr. Sr. Sr. Entering scores CLA Score B F F F F A F F SAT Score The Collegiate Learning Assessment Allows Longitudinal Measurement of the Individual Student Individual Level (Cross-sectional and Longitudinal)
Possible elements of a public report “Value Added” will be Included based on one or more test results. http://nces.ed.gov/ipeds/cool/index.aspx
Appendix ISpecific Recommendations of the Spellings Commission
Recommendation #1 The U.S. should commit to expanding higher education access and success by improving student preparation and persistence, addressing nonacademic barriers, and providing significant increases in aid to low-income students.
Recommendation #2 Restructure the entire student financial aid system. Put in place new incentives to improve the measurement and management of costs and institutional productivity.
Recommendation #3 Change from a higher education system primarily based on reputation to one based on performance. Institutions must embrace and implement serious accountability measures.
Recommendation #4 Colleges and universities must embrace continuous innovation and quality improvement by developing new pedagogies, curricula, and technologies to improve learning, particularly in science and mathematical literacy areas.
Recommendation #5 Develop a national strategy for lifelong learning to help citizens understand the importance of preparing for and participating in higher education throughout their lives.
Recommendation #6 Increase federal investment in areas critical to global competitiveness; a renewed commitment to attract the best and brightest minds from across the nation and around the world to lead the next wave of American innovation.