Understanding Economic Costs
130 likes | 230 Vues
Learn to define and calculate total, average, and marginal costs. Understand the difference between short-run and long-run costs. Explore economies of scale, diseconomies of scale, and draw the LR cost curve.

Understanding Economic Costs
E N D
Presentation Transcript
By the end of this section, you should be able to….. • Define and calculate total cost, average cost, and marginal cost. • Graphically depict the total cost, fixed costs and variable cost curves. • Discuss the difference between costs in the SR and in the LR • Know if you have economies of scale, diseconomies of scale or negative economies of scale and what that means. • Draw the LR cost curve.
Costs Overview • Costs are looked at in different ways in the short run and in the long run. • The short run is a time period in which producers are able to change the quantities of some but not all of the resources they employ. • A firm can adjust the number of workers but not the plant’s capacity in the short run. • The long run is a time period sufficiently long to enable producers to change the quantities of all the resources they employ.
Short Run Costs • Total Cost: the cost of all the factors of production used by a firm. • TC = FC + VC Total Fixed Costs are the costs of fixed factors of production used by a firm. These factors can not be changed in the short run. Examples include capital, cost of land, etc. ****There are no fixed costs in the long run. Total Variable Costs are the cost of the variable factors of production used by a firm. Example quantity of labor employed.
Total Cost Curves Total Cost Curve=FC+VC Total Costs Variable Cost Curve Fixed Cost Curve Fixed Costs Amount Variable Cost Amount at a given output. Output
Average Costs • Q is quantity of output. • Average fixed costs: AFC=TFC/Q • Average fixed costs decline as output increases because the total fixed costs are spread over a larger and larger output. • Average variable costs: AVC=TVC/Q • As added variable resources increase output, average variable cost declines initially, reaches a minimum, and then increases again. As a result, AVC is U-shaped. • Average total costs: ATC=TC/Q=AFC+AVC • Graphically, ATC can be found by vertically adding the AFC and AVC curves.
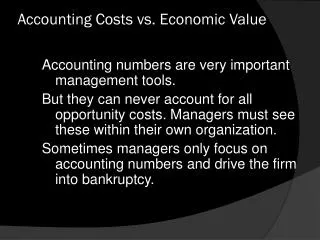
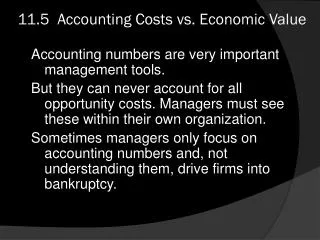
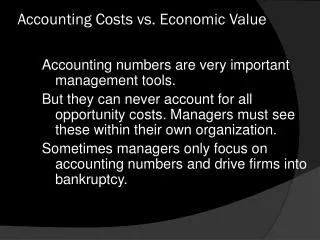
Total Costs vs. Average Costs • Total Costs look at the costs at a particular output level. • Average Costs looks at the average amount of each type of cost over all of the output produced up to a certain production amount.
Marginal Cost • Marginal Cost is the change in total cost that results from a one unit increase in output. • It is the cost of producing one extra unit of output. • MC = TC = TC1 – TC2 Q Q1 - Q2 • See how TC changes as output changes. Graphically, the MC curve intersects the AVC curve at its minimum…
$200 150 100 Costs 50 0 10 1 2 3 4 5 6 7 8 9 Q Average and Marginal Cost Curves MC AFC ATC AVC AVC AFC
Numeric Example • Example: Sam owns a Smoothie Shop • Suppose Sam produces 5 gallons an hour at a cost of $26.20 and produces 6 gallons of smoothies an hour at a total cost of $28.00. • Total Costs • Total Cost at 5 Gallons = $26.20 • Total Cost at 6 Gallons = $28.00 • Average Costs • Average Cost at 5 Gallons = $5.24 (=TC/Q=$26.20/5) • Average Cost at 6 Gallons = $4.67 (=TC/Q=$28.00/6) • Marginal Costs • Marginal Cost at 6 Gallons = $1.80 (= TC/ Q=(28.00-26.20)/(6-5)
Long Run Costs • In the Long Run, the firm can vary the quantity of labor (L) (variable in the short run) and quantity of capital (K) (fixed in the short run).
Changing Amount of Labor and Capital Could Cause 1 of 3 Things • Economies of Scale: Output increases by an even higher % than the % a firm increases its inputs (K and L) by. • Diseconomies of Scale: Output increases by a smaller % than the % a firm increases its inputs by. • Constant Returns to Scale: Output increases by the same % that a firm increases its inputs by.
Long-Run ATC Curve Constant Returns to Scale where LRATC Curve is flat ATC-1 ATC-5 ATC-2 Long-Run ATC ATC-4 ATC-3 Average Total Costs Diseconomies of Scale where LRATC Curve is sloped upward Economies of Scale where LRATC Curve is sloped downward Output The long-run ATC curve just “envelopes” the short run ATCs