Understanding Population Ecology: Patterns of Distribution and Growth in Aspen Clones
This text explores the concept of population ecology using aspen clones as examples of genetic individuals, or 'genets'. It discusses the hierarchical organization of life, emphasizing the relationships and interactions within populations, communities, and ecosystems. We examine demographic processes such as birth, immigration, death, and emigration (BIDE) that shape population dynamics. The distribution patterns of populations—including random, clumped, and uniform arrangements—are explored through various ecological principles, highlighting how resource availability and social behaviors influence these patterns over time.

Understanding Population Ecology: Patterns of Distribution and Growth in Aspen Clones
E N D
Presentation Transcript
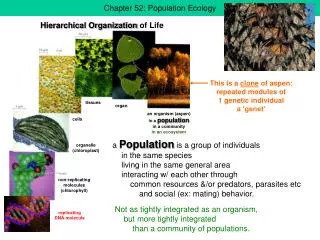
Chapter 52: Population Ecology This is a clone of aspen: repeated modules of 1 genetic individual a ‘genet’ tissues organ an organism (aspen) in a population in a community in an ecosystem cells organelle (chloroplast) non-replicating molecules (chlorophyll) replicating DNA molecule Hierarchical Organization of Life a Population is a group of individuals in the same species living in the same general area interacting w/ each other through common resources &/or predators, parasites etc and social (ex: mating) behavior. Not as tightly integrated as an organism, but more tightly integrated than a community of populations.
Demographic processes (ex: Birth, Immigration, Death, Emigration) within Populations create patterns of Distribution and Abundance (text Fig 52.2) Begin w/ a null model - the distribution is ‘random’ a) nearest neighbor distances, or b) number indiv’s in small sample quadrats (like expected chocolate chips per cookie if Poisson) Nonrandom spatial distribution patterns suggest hypothetical processes. If there are too many short nearest neighbor distances, or the variance in # indiv’s per quadrat is too high, then reject the null model that the distribution is random. Potential processes include aggregation at patchy resources and/or social attraction to each other If there is too little variation in nearest neighbor distances, or in # indiv’s per quadrat, then reject the null model. If we know abundance (n = 16) & area (& a little probability theory) we can construct expected random distribution of The distribution pattern is Clumped. The distribution pattern is Uniform (or hyperdispersed) Potential processes include resource competition and aggression.
At continental scale, breeding birds clumped in regions, biomes, habitats (grasslands, pastures) Within habitats, aggregate at profitable patches (heavily grazed) Within patches, territories uniform Within territories, behaviors ‘aggregated’ over microhabitats The spatial distribution pattern is ‘scale sensitive’ In general, if you look at a big enough scale, things tend to be clumped but if you look at a small enough scale they tend to be hyperdispersed.
One of the most fundamental patterns in a population is Abundance through Time. Begin w/ simple binary fission in bacteria. Population growth or decline depends on demographic processes of Birth, Immigration, Death & Emigration. (BIDE) These demographic processes depend on ecological interactions, like resource competition, predation, disease etc, and on details ofpopulation structure, like proportion of mature females and life history characteristics, like age at 1st repro, offspring per ‘clutch’ etc., that we will consider later. We use population growth models to describe past patterns and to predict future patterns.
Suppose we start w/ 1 bacteria at time t = 0: N0 = 1, and at each unit of time the bacteria undergoes binary fission and the number of bacteria doubles. Begin with geometric growth: Then N0 = 1 2 N0 = N1 = 2 = 21 2 N1 = N2 = 4 = 22 2 N2 = N3 = 8 = 23 … 2 Nt-1 =Nt = N0 2t … In the text example (pg 1158), 1 unit of time = 20min; 36hr = 108 units of time, and N108= 12108= enough to bury the earth! The geometric growth rate per unit time is = ( Nt/ Nt-1 ). In the text bacteria example, = 2 per 20 min. = 20min Can you figure out per hour? hr = 2(60/20) = 23 = 8 per hr Can you figure out per min? min = 2(1/20) = 20.05 = 1.035 per min
Instead of projecting future geometric growth, lets look back at our ancestors: Nt = N0 2t … If we look back 1 generation, we each have 2 parents. Fig 52.20 in the text shows the human pop on earth in year 0 200 million. 200 million = 200,000,000 = 2 27.58 << 280 ! What does that suggest? If we look back 2 generations, each of our 2 parents had 2 parents. Suppose humans have about 4 generations per century. If we project back to the year 0, about how many generations are we projecting back? (80) (280) How many ancestors should we each have living then? Geometric growth is a discrete model; it is more convenient to work w/ a continuous model, so we can use calculus!
A compartmental model w/ fluxes and standing stocks (or pools) IN = births + immigration (ignore for now) Nt-1 Nt t OUT = deaths + emigration (ignore for now) If we have things in a compartment (ex: indiv’s in a pop; molecules in a lake, etc) and a conservation property, then: Nt = Nt-1 + IN - OUT. N/t = Nt - Nt-1 = IN - OUT = Births - Deaths(assuming no migration) Now, we are interested in processes and these are easier to see if we convert absolute number of Bs & Ds, into the per capita (per individual) rates b & d: B = bN & D = dN, then N/t = Nt - Nt-1 = Births - Deaths = bN - dN= N (b - d) Let t get small & let (b - d)=r = instantaneous per capita population growth rate. Then we have the differential form dN/dt = rN
We can rearrange Nt = N0 ertto isolate t = ln(Nt/N0)/r and then see that the pop doubles every td = ln(2)/r= 0.69/r units of time. Text pg 1168: the human pop doubled between 1930-1975 (45 yrs). What was ave r? 45 = 0.69/r r = 0.69/45 = 0.0153 = 1.53% per yr We have derived dN/dt = rN, wherer = instantaneous per capita population growth rate. (it’s also the compound interest rate) Notice that the rate of change in N is proportional to N; the bigger N is the faster it increases; this is + feedback & N ‘explodes’! We can rearrange this to the form dN/N = r dt, then integrate both sides to find: Nt = N0 ert , the exponential growth model (conveniently, er = , the geometric growth rate) Note, human r is not constant, it is increasing & doubling time is decreasing!!!!!
Recall thatr = b - d; the decline in r w/ increasing density results from decreasing b &/or increasing d (decreasing survival) Many pop’s will start a pattern of exponential growth, but it is unsustainable; at some point, birth rates must decline &/or death rates increase, resulting in a decline of the rate of increase r with increasing density. {note the overshoot & damped oscillation toward carrying capacity} Density dependent population regulation = -FB: N r via limiting resources (see Malthus pg 435) &/or, increased aggression, predation, disease …
A simple way to model that is to let r = rmax (1 - N/K) The logistic growth model: dN/dt = rN = [rmax (1 - N/K)] N {note that dN/dt is the slope of N vs t} To make our exponential growth model more realistic, we need to make the rate of increase r = b - d decline as the pop size N approaches the carrying capacity K; Want r = rmax at N near 0 & r = 0 as N approaches K Notice that this regulates N by negative feedback,: the set point is K; when N<K, r>0; when N>K, r<0; the pop N should approach or cycle around K, but the dynamics can get chaotic!
The logistic growth model: dN/dt = rN = [rmax (1 - N/K)][N] @N=0: r = rmax N N* r=0 @N = K K/2 N 0 = [rmax (1 - N/K)] [1] + [rmax ( -1/K)] [N] 0 = 1 - N/K - N/K = 1 - 2N/K N* = K/2 The population reproduces fastest at intermediate size; below that, too few females to max rate; above that, too much intraspecific competition If you want to find the pop size N* where dN/dt is at maximum (growing fastest), take the derivative of (dN/dt ) with respect to N, set it equal to 0 & solve for N* This is the foundation for the concept of Maximum Sustainable Yield (MSY) in wildlife management (in practice, more sophisticated, age structured models used)
We’d like to see a map of N(t), to visualize the population dynamics predicted by the logistic model. Unfortunately, it is ‘very difficult’ to solve the equation [ dN/dt = [rmax (1 - N/K)] N ] for N(t) = an explicit function f(K, rmax,N0,t). So, let’s go back to a discrete approximation: Nt = [ (1 - Nt-1/K) ] Nt-1 , where corresponds to the instantaneous rate rmax integrated over the discrete interval t. Simplify further by dividing both sides by K, so that xi = Ni/K = pop size relative to K. Now we have a discrete logistic model: xt = [ (1 - xt-1) ] xt-1 , that we can explore w/ a spreadsheet. at small (2.0), nice logistic growth {a simplifying quirk: approaches K/2} However, as gets larger (4.8), strange things begin to appear; all chaos breaks loose!
= 3.2: stable limit cycle w/ 2 pts = 3.5: stable limit cycles w/ 4 pts X X = 2.8: damped oscillations X X = 4.8: ‘chaotic meandering’ = 2.0: asymptote to 1 stable pt
http://theoryx8.uwinnipeg.ca/fractals/Fractal_chaos.html What is Chaos? … in the 1960's, a meteorologist named Edward Lorenz … was attempting to find a way to predict the outcome of simulated weather patterns in a mathematical model he had patterned after the Earth's climate. Noticing that these patterns did not follow any "predictable" evolution as the simulation progressed, he eventually came upon the realization that his model was extremely sensitive to the numerical data he fed into his computer; slight variations in numerical precision could cause his model to evolve in a radically different way than predicted … In other words, the model Lorenz had created exhibited a property of SENSITIVE DEPENDENCE ON INITIAL CONDITIONS{‘the butterfly effect’} … the hallmark of what has now become known as DETERMINISTIC CHAOS, a phenomenon that has been recognized within a variety of physical systems such as plasmas, fluid dynamics, and biological processes. More formally, Baker and Gollub (1996) define deterministic chaos as being "the irregular and unpredictable time evolution of ... nonlinear systems", and further state that "its central characteristic is that the system does not repeat its past behaviour … " (p.1).
Furthermore, it can be difficult to infer the simple generating process from the very complex resulting pattern. Mathematical and philosophical thriller, July 19, 2000 Reviewer: Todd McFarland Gleick's "Chaos" will change the way you look at the world. Not once, not twice, but three times, I found myself, jaw agape, staring through the text into infinity and pondering the immensity of what I had just read. This is as much a testament to Gleick's powerful prose as it is to the profound implications of chaos theoryhttp://www.amazon.com The big picture:(see http://www.imho.com/grae/chaos/chaos.html) simple deterministic processes can generate very complex patterns; so complex that they look ‘random.’
http://www.seagrant.wisc.edu/communications/publications/One-pagers/yellowperchFactSheet.htmlhttp://www.seagrant.wisc.edu/communications/publications/One-pagers/yellowperchFactSheet.html People all around Lake Michigan are asking questions about the nine-year decline in yellow perch populations. The Lake Mi perch pop has small proportion of females and too few young age classes to replace older age classes as they die off. Most multicellular organisms grow for a while, then they reproduce, if they survive, if they are female. We can usually make much better predictions and management decisions if we develop age (or stage) structured demographic models, based on age x, the probability of surviving to age x = lx and the average reproduction if she does survive to x = bx … few young perch are surviving to adulthood. … the average age of the population is increasing quickly. … the percentage of females in the population has declined swiftly during the 1990s. In 1998, females … constituted only 20 percent of the perch population. … new females are not replacing the old ones lost to fishing and natural mortality. With few females available to spawn, the yellow perch population could collapse.
Life tables: A Cactus Ground Finch cohort ( old edition Table 52.1) If we can measure Age x & count # still alive at start of x, we can calculate pr(survive into x) = l(x) If we can count babies born to those females lucky enough to be alive at x:b(x) we can combine w/ l(x) & calculate expected future repro to females of age x On ave, newborn females age 0, have 2.1 babies: (Fundamental rate R) From the survivorship curve we see that many die in 1st year Skip your Table 52.1, the †† make it too confusing! However, because 49% females die in 1st year, before any babies, older females have higher future reproduction (‘value’). ‘Repro Value’ important in management decisions
Carrying capacity in agriculture: global and regional issues.Harris, JM &Kennedy S 1999. Ecological Economics 29:443-461. Abstract:… on the issue of yield growth. 'Optimists' base their analyses on a technology- and input-driven rate of increase in yields which, they argue, has outpaced population growth and will continue to do so, leaving a margin for steady increase in per capita incomes. … 'pessimists' (we prefer the term 'ecological realists') see practical limits to global carrying capacity in agriculture, and maintain that the world is close to, or may even have passed, these limits. We investigate the pattern of yield growth for major cereal crops, and present evidence that the growth pattern is logistic, not exponential. This pattern is consistent with ecological limits on soil fertility, water availability, and nutrient uptake. Projections for supply and demand in the twenty-first century based on a logistic rather than an exponential model of yield growth imply that the world is indeed close to carrying capacity in agriculture, and that specific resource and ecological constraints are of particular importance at the regional level. A supply-side strategy of increased production has already led to serious problems of soil degradation and water overdraft, as well as other ecosystem stresses. This implies thatdemand-side issues of population policy and efficiency in consumption are crucial to the development of a sustainable agricultural system.
http://www.ecouncil.ac.cr/rio/focus/report/english/footprint/benchmark.htmhttp://www.ecouncil.ac.cr/rio/focus/report/english/footprint/benchmark.htm The Ecological Benchmark: How Much Nature is there per Global Citizen? Adding up the biologically productive land per capita world-wide of 0.25 hectares of arable land, 0.6 hectares of pasture, 0.6 hectares of forest and 0.03 hectares of built-up land shows that there exist 1.5 hectares per global citizen; and 2 hectares once we also include the sea space. {1ha = 2.47 acres} Not all that space is available to human use as this area should also give room to the 30 million fellow species with whom humanity shares this planet. … at least 12 percent of the ecological capacity … should be preserved for biodiversity protection. … only 1.7 hectares per capita are available for human use. Assuming no further ecological degradation, the amount of available biologically productive space will drop to 1 hectare per capita once the world population reaches its predicted 10 billion. If current growth trends persist, this will happen in only little more than 30 years.
Humans are not exempt from natural processes. No population, including the human population, can grow indefinitely. A more pressing problem than ‘What will life be like when we reach K?’ is ‘How will we cope with aggression triggered by resource competition related to variation in the quality of life?’ Right now, for humans there is no sign of a gradual approach to K. Attempts to estimate earth’s K for humans dissolve into questions about ‘quality of life.’ http://www.popexpo.net/eMain.html