Basic Verification Concepts
Basic Verification Concepts. Barbara Brown National Center for Atmospheric Research Boulder Colorado USA bgb@ucar.edu March 2014 New Delhi, India. Basic concepts - outline. What is verification? Why verify? Identifying verification goals Forecast “goodness”

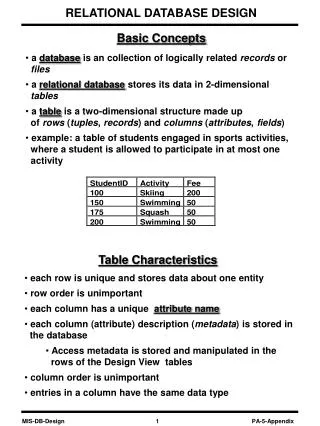
Basic Verification Concepts
E N D
Presentation Transcript
Basic Verification Concepts Barbara Brown National Center for Atmospheric Research Boulder Colorado USA bgb@ucar.edu March 2014 New Delhi, India
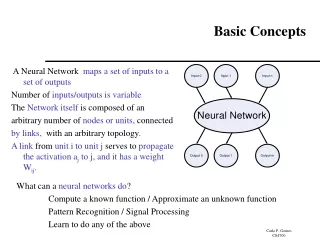
Basic concepts - outline • What is verification? • Why verify? • Identifying verification goals • Forecast “goodness” • Designing a verification study • Types of forecasts and observations • Matching forecasts and observations • Statistical basis for verification • Comparison and inference • Verification attributes • Miscellaneous issues • Questions to ponder: Who? What? When? Where? Which? Why?
What is verification? Verify: ver·i·fyPronunciation: 'ver-&-"fI1: to confirm or substantiate in law by oath2: to establish the truth, accuracy, or reality of <verify the claim>synonym see CONFIRM • Verification is the process of comparing forecasts to relevant observations • Verification is one aspect of measuring forecast goodness • Verification measures the quality of forecasts (as opposed to their value) • For many purposes a more appropriate term is “evaluation”
Why verify? • Purposes of verification (traditional definition) • Administrative • Scientific • Economic
Why verify? • Administrative purpose • Monitoring performance • Choice of model or model configuration (has the model improved?) • Scientific purpose • Identifying and correcting model flaws • Forecast improvement • Economic purpose • Improved decision making • “Feeding” decision models or decision support systems
Why verify? • What are some other reasons to verify hydrometeorological forecasts?
Why verify? • What are some other reasons to verify hydrometeorological forecasts? • Help operational forecasters understand model biases and select models for use in different conditions • Help “users” interpret forecasts (e.g., “What does a temperature forecast of 0 degrees really mean?”) • Identify forecast weaknesses, strengths, differences
Identifying verification goals • What questions do we want to answer? • Examples: • In what locations does the model have the best performance? • Are there regimes in which the forecasts are better or worse? • Is the probability forecast well calibrated (i.e., reliable)? • Do the forecasts correctly capture the natural variability of the weather? Other examples?
Identifying verification goals (cont.) • What forecast performance attributeshould be measured? • Related to the question as well as the type of forecast and observation • Choices of verification statistics/measures/graphics • Should match the type of forecast and the attribute of interest • Should measure the quantity of interest (i.e., the quantity represented in the question)
Forecast “goodness” • Depends on the quality of the forecast AND • The user and his/her application of the forecast information
F O Good forecast or bad forecast? Many verification approaches would say that this forecast has NO skill and is very inaccurate.
F O Good forecast or Bad forecast? If I’m a water manager for this watershed, it’s a pretty bad forecast…
F O A B Flight Route Good forecast or Bad forecast? O If I’m an aviation traffic strategic planner… It might be a pretty good forecast Different users have different ideas about what makes a forecast good Different verification approaches can measure different types of “goodness”
Forecast “goodness” • Forecast quality is only one aspect of forecast “goodness” • Forecast value is related to forecast quality through complex, non-linear relationships • In some cases, improvements in forecast quality (according to certain measures) may result in a degradation in forecast value for some users! • However - Some approaches to measuring forecast quality can help understand goodness • Examples • Diagnostic verification approaches • New features-based approaches • Use of multiple measures to represent more than one attribute of forecast performance • Examination of multiple thresholds
Basic guide for developing verification studies Consider the users… • … of the forecasts • … of the verification information • What aspects of forecast quality are of interest for the user? • Typically (always?) need to consider multiple aspects Develop verification questions to evaluate those aspects/attributes • Exercise: What verification questions and attributes would be of interest to … • … operators of an electric utility? • … a city emergency manager? • … a mesoscale model developer? • … aviation planners?
Basic guide for developing verification studies Identify observationsthat represent the eventbeing forecast, including the • Element (e.g., temperature, precipitation) • Temporal resolution • Spatial resolution and representation • Thresholds, categories, etc. Identify multiple verification attributesthat can provide answers to the questions of interest Select measures and graphicsthat appropriately measure and represent the attributes of interest Identify a standard of comparisonthat provides a reference level of skill (e.g., persistence, climatology, old model)
Types of forecasts, observations • Continuous • Temperature • Rainfall amount • 500 mb height • Categorical • Dichotomous • Rain vs. no rain • Strong winds vs. no strong wind • Night frost vs. no frost • Often formulated as Yes/No • Multi-category • Cloud amount category • Precipitation type • May result from subsetting continuous variables into categories • Ex: Temperature categories of 0-10, 11-20, 21-30, etc.
Types of forecasts, observations • Probabilistic • Observation can be dichotomous, multi-category, or continuous • Precipitation occurrence – Dichotomous (Yes/No) • Precipitation type – Multi-category • Temperature distribution - Continuous • Forecast can be • Single probability value (for dichotomous events) • Multiple probabilities (discrete probability distribution for multiple categories) • Continuous distribution • For dichotomous or multiple categories, probability values may be limited to certain values (e.g., multiples of 0.1) • Ensemble • Multiple iterations of a continuous or categorical forecast • May be transformed into a probability distribution • Observations may be continuous, dichotomous or multi-category 2-category precipitation forecast (PoP) for US ECMWF 2-m temperature meteogram for Helsinki
Matching forecasts and observations • May be the most difficult part of the verification process! • Many factors need to be taken into account • Identifying observations that represent the forecast event • Example: Precipitation accumulation over an hour at a point • For a gridded forecast there are many options for the matching process • Point-to-grid • Match obs to closest gridpoint • Grid-to-point • Interpolate? • Take largest value?
Matching forecasts and observations • Point-to-Grid and Grid-to-Point • Matching approach can impact the results of the verification
0 20 Obs=10 Fcst=0 10 20 20 0 20 Obs=10 Fcst=15 10 20 20 Matching forecasts and observations Example: • Two approaches: • Match rain gauge to nearest gridpointor • Interpolate grid values to rain gauge location • Crude assumption: equal weight to each gridpoint • Differences in results associated with matching: “Representativeness” difference Will impact most verification scores
Matching forecasts and observations Final point: • It is not advisable to use the model analysis as the verification “observation” • Why not??
Matching forecasts and observations Final point: • It is not advisable to use the model analysis as the verification “observation” • Why not?? Issue: Non-independence!! • What would be the impact of non-independence? “Better” scores… (not representative)
training notes Observation characteristics and their impacts
Observations are NOT perfect! • Observation error vs predictability and forecast error/uncertainty • Different observation types of the same parameter (manual or automated) can impact results • Typical instrument errors are: • For temperature: +/- 0.1oC • For wind speed: speed dependent errors but ~ +/- 0.5 m/s • For precipitation (gauges): +/- 0.1 mm (half tip) but up to 50% • Additional issues: Siting issues (e.g., shielding/exposure) • In some instances “forecast” errors are very similar to instrument limits
Effects of observation errors • Observation errors add uncertainty to the verification results • True forecast skill is unknown • Extra dispersion of observation PDF • Effects on verification results • RMSE – overestimated • Spread – more obs outliers make ensemble look under-dispersed • Reliability – poorer • Resolution – greater in BS decomposition, but ROC area poorer • CRPS – poorer mean values • Basic methods available to take into account the effects of observation error • More samples can help (reliability of results) • Quantify actual observation errors as much as possible
Statistical basis for verification Any verification activity should begin with a thorough examination of the statistical properties of the forecasts and observations. • E.g. many tools are based on assumptions of normality (Gaussian distribution). Does this hold for the dataset in question? • Is the forecast capturing the observed range? • Do the forecast and observed distributions match/agree? • Do they have the same mean behavior, variation etc?
Statistical basis for verification Beyond the need to assess the characteristics of the data… Joint, marginal, and conditional distributions are useful for understanding the statistical basis for forecast verification • These distributions can be related to specific summary and performance measures used in verification • Specific attributes of interest for verification are measured by these distributions
Statistical basis for verification Basic (marginal) probability is the probability that a random variable, X, will take on the value x Example: • X = age of tutorial participant (students + teachers) • What is an estimate of Pr(X=30-34) ?
Marginal distribution of “age” N = 37 Pr (Age is 30-34) = Pr(X=30-34)
Basic probability Joint probability = probability that both events x and y occur Example: What is the probability that a participant’s age is between 30 and 34 (X = “30-34”)AND the participant is female (Y = “female”) = Pr(X = 30-34, Y = female)
Joint distribution of “age” and “gender” N= 37 Pr(participant’s age is 30-34 and participant is female) = Pr (X = 30-34 AND Y = female)
Basic probability Conditionalprobability = probability that event x is true (or occurs) given that event y is true (or occurs) Example: If a participant is female, what is the likelihood that she is between 30-34 years old?
Conditional age distributions How does this probability compare to the overall probability of being between 30-34 years of age?
What does this have to do with verification? Verification can be represented as the process of evaluating the joint distribution of forecasts and observations, • All of the information regarding the forecast, observations, and their relationship is represented by this distribution • Furthermore, the joint distribution can be factored into two pairs of conditional and marginal distributions:
Decompositions of the joint distribution • Many forecast verification attributes can be derived from the conditional and marginal distributions • Likelihood-base rate decomposition • Calibration-refinement decomposition Likelihood Base rate Refinement Calibration
Graphical representation of distributions Joint distributions • Scatter plots • Density plots • 3-D histograms • Contour plots
Graphical representation of distributions Marginal distributions • Stem and leaf plots • Histograms • Box plots • Cumulative distributions • Quantile-Quantile plots
Graphical representation of distributions Marginal distributions • Density functions • Cumulative distributions Obs GFS Temp Temp Temp
Graphical representation of distributions Conditional distributions • Conditional quantile plots • Conditional boxplots • Stem and leaf plots
Exercise: Stem and leaf plots Probability forecasts (Tampere)
Stem and leaf plots: Marginal and conditional Marginal distribution of Tampere probability forecasts Conditional distributions of Tampere probability forecasts Instructions: Mark X’s in the appropriate cells, representing the forecast probability values for Tampere. The resulting plots are one simple way to look at marginal and conditional distributions. What are the differences between the Marginal distribution of probabilities and the Conditional distributions? What do we learn from those differences?
Comparison and inference Skill scores • A skill score is a measure of relative performance • Ex: How much more accurate are my temperature predictions than climatology? How much more accurate are they than the model’s temperature predictions? • Provides a comparison to a standard • Measures percent improvement over the standard • Positively oriented (larger is better) • Choice of the standard matters (a lot!) Question: Which standard of comparison would be more difficult to “beat”: climatology or persistence For • A 72-hour precipitation forecast? • A 6-hour ceiling forecast?
Skill scores Generic skill score definition: Where M is the verification measure for the forecasts, Mref is the measure for the reference forecasts, and Mperfis the measure for perfect forecasts Example: for Mean-squared error (MSE)
Comparison and inference Uncertainty in scores and measures should be estimated whenever possible! • Uncertainty arises from • Sampling variability • Observation error • Representativeness differences • Others? • Erroneous conclusions can be drawn regarding improvements in forecasting systems and models • Methods for confidence intervals and hypothesis tests • Parametric (i.e., depending on a statistical model) • Non-parametric (e.g., derived from re-sampling procedures, often called “bootstrapping”) More on this topic to be presented tomorrow