Color Vision Fundamentals
230 likes | 387 Vues
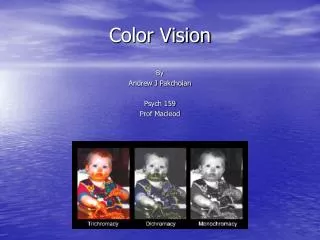
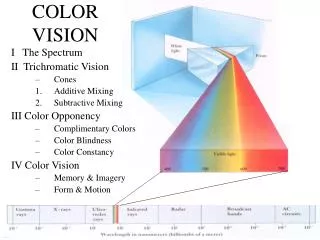
Color Vision Fundamentals. Jeff Rabin, OD, PhD Chief, Visual Function Laboratory Ophthalmology Branch USAF School of Aerospace Medicine. 700. 600. 500. 400. Visible light is small part of electromagnetic spectrum. IR. UV.

Color Vision Fundamentals
E N D
Presentation Transcript
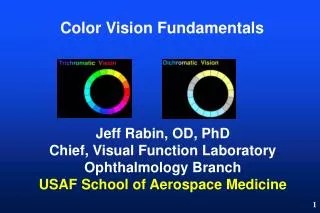
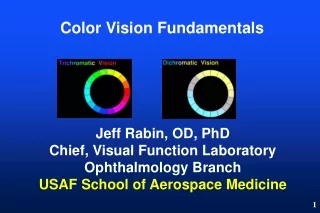
Color Vision Fundamentals Jeff Rabin, OD, PhD Chief, Visual Function Laboratory Ophthalmology Branch USAF School of Aerospace Medicine
700 600 500 400 • Visible light is small part of electromagnetic spectrum. IR UV
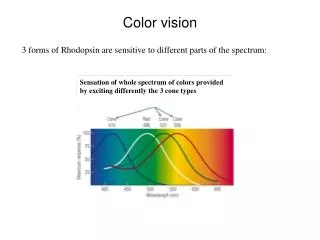
The visible spectrum includes 300 wavelengths (400-700 nm), and in some portions we can discern color differences of 1 wavelength. The ability to see so many colors depends on: • a separate cone for each wavelength. • optic nerve fibers for each color. • visual cortex neurons sensitive to each color. • difference in stimulation of red, green and blue sensitive cones.
Retinal Cones–Normal Color Vision Blue cones absent in central fovea • Red cones • Green cones • Blue cones • Brightness = R + G • Color = R – G • Color = B – (R+G) • Red cones outnumber green cones 2/1 • Red + Green cones outnumber blue cones 10/1
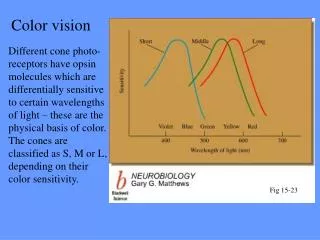
Retinal Cones–Normal Color Vision Red, green and blue cone sensitivity vs. wavelength curves
What happens in hereditary color deficiency? • Red or green cone peak sensitivity is shifted. • Red or green cones absent.
NORMAL CONE SENSITIVITY CURVES(TRICHROMAT) 533 nm 437 nm 564 nm B G R
G 5% of Males 437 nm 564 nm B R Deuteranomaly(green shifted toward red)
G 1% of Males Deutan Dichromat(no green cones; only red and blue) 437 nm 564 nm B R
1% of Males(there is no green curve) 437 nm 564 nm R B Deutan Dichromat(no green cones; only red and blue)
R 1% of Males Protanomalous (red shifted toward green) 533 nm 437 nm B G
R 1% of Males 533 nm 437 nm B G Protan Dichromat(no red cones; only green and blue)
1% of Males(there is no red curve) 533 nm 437 nm B G Protan Dichromat(no red cones; only green and blue)
Why do colors that look different to us appear the same to color deficient individuals?
Consider a green vs. yellow light… The two spots appear different in color because R-G is large for one, and small for the other. Small difference in stimulation Large difference in stimulation of green and red cones G B R Color Normal Individual
Small difference in stimulation G Small difference in stimulation Look the same! Each spot produces the same R-G stimulation and thus looks the same! B R Deuteranomaly (the green sensitivity curve is shifted toward the red)
Some Views With and Without Color Vision Link Jay and Maureen Neitz Color Vision Page
Drs. Jay and Maureen NeitzDepartment of Cell Biology, Neurobiology & AnatomyDepartment of OphthalmologyMedical College of Wisconsin
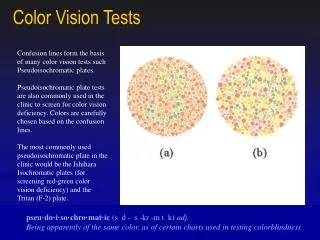
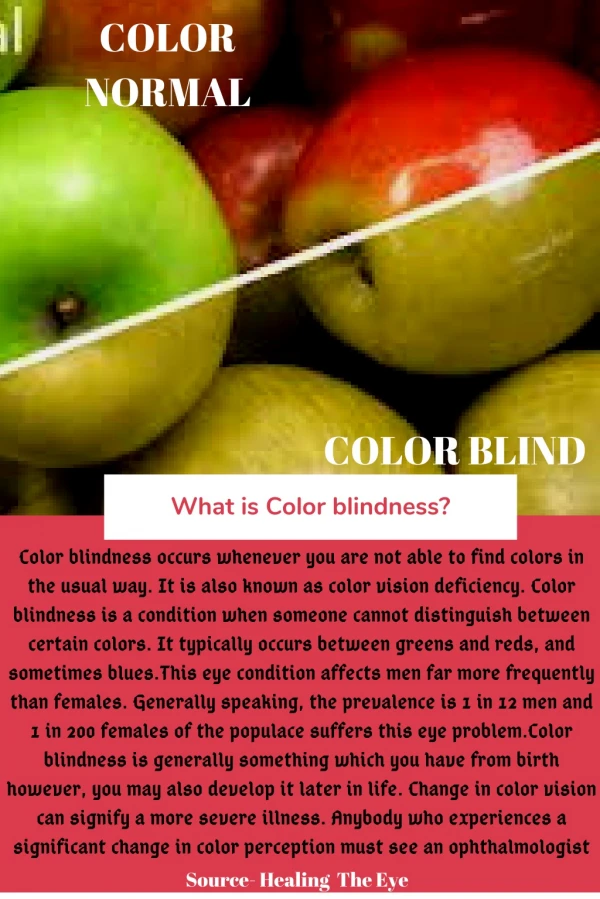
Color Labeling • Color deficients rely heavily on context and learning—apple is “red” because patient learns to call it red —same hue may appear gray when presented without other cues. • For wavelengths beyond 545, relative brightness, context, and learning play a significant role verbal label and response.
Hereditary Color Deficiency • 8-10% of males and 1/200 females (0.5%) are born with red or green color deficiency. • Sex-linked recessive condition (X chromosome). • Protanomaly—red cone peak shifted toward green (1%) • Protan Dichromat—red cones absent (1%) • Deuteranomaly—green cone peak shifted toward red (5%) • Deutan Dichromat—green cones absent (1%) • Hereditary tritan defects are rare (0.008%)