Download
1 / 27
270 likes | 427 Vues
How the Chesapeake Bay Watershed Partners Reached Agreement on Nutrient and Sediment Load Reductions and Caps. Richard Batiuk Associate Director for Science U.S. EPA Chesapeake Bay Program Office January 24, 2005.

E N D
How the Chesapeake Bay Watershed Partners Reached Agreement on Nutrient and Sediment Load Reductions and Caps Richard Batiuk Associate Director for Science U.S. EPA Chesapeake Bay Program Office January 24, 2005
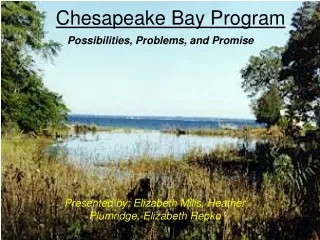
Over 90% of the Bay and its tidal rivers are impaired due to low dissolved oxygen levels and poor water clarity, all related to nutrient and sediment pollution. Without oxygen and grasses, the Bay’s crabs, oysters, and fish cannot survive and thrive. Impaired Water
June 2005 Bottom Dissolved Oxygen Baltimore Washington, DC Extensive low to no dissolved oxygen conditions persist throughout the Chesapeake Bay Richmond Norfolk
Sediments from the Susquehanna can impact Bay grass bay beds throughout the upper Chesapeake Bay
What Do We Want to Achieve? Water quality that supports abundant fish, crabs, oysters and underwater grasses in the Bay and its rivers.
Partners Commitment to Restored Bay Water Quality “By 2010, correct the nutrient‑ and sediment‑related problems in the Chesapeake Bay and its tidal tributaries...” Step 1: What is the water quality of a restored Bay? Step 2: How much pollution do we need to reduce? Step 3: What actions do we need to take to reduce pollution?
Water Quality in a Restored Bay • Fewer algae blooms and better fish food. • Clearer water and more underwater Bay grasses. • More oxygen and improved habitat for more fish, crabs and oysters.
Local “Zoning” for Bay and River Fish, Crab and Grasses Habitats Shad, Herring, Perch and Rockfish Spawning Habitat Bay Grasses Habitat Rockfish, Bluefish Menhaden Habitat Oyster, Crab, Croaker and Spot Habitat Summertime Crab Food Habitat
Bay Dissolved Oxygen Criteria Minimum Amount of Oxygen (mg/L) Needed to Survive by Species Migratory Fish Spawning & Nursery Areas 6 Striped Bass: 5-6 American Shad: 5 Shallow and Open Water Areas 5 White Perch: 5 4 Yellow Perch: 5 Hard Clams: 5 Deep Water Alewife: 3.6 3 Bay Anchovy: 3 Crabs: 3 2 Deep Channel 1 Spot: 2 Worms: 1 0
MD, VA, DE and DC have adopted the 185,000 acre Bay grasses restoration goal into their state water quality standard regulations Bay Grasses Restoration Goal
Scientific Basis for Decisions was Documented by the Partners
Chesapeake Bay Program -Current Models Nitrate and ammonia deposition from Regression Model (NADP concentrations, precipitation, time, and latitude) applied to precipitation data from gauging stations. Adjustments to deposition from Regional Acid Deposition Model (RADM) Chesapeake Bay Estuary Model Package Hydrodynamic Model, Sediment Benthic Model, and Submerged Aquatic Vegetation Chesapeake Bay Watershed Model Lumped-parameter, physically-based Land and water simulation, Nutrient and sediment simulation
phosphorus nitrogen Nutrient Loadings vs. Dissolved Oxygen Criteria Attainment 337 285 175 26.5 19.1 12.8 Millions of pounds per year % Dissolved Oxygen Criteria Attainment
Relative Impact on Dissolved Oxygen
Allocating the Cap Loads …then by 44 state-defined tributary strategy subbasins ...then by 20 major tributary basins by jurisdiction By 9 major river basins Watershed States Responsibility Watershed States Responsibility Watershed Partners Responsibility
All 439 significant NPDES permitted facilities are now required to have annual N and P loads in their permits
On the Horizon -- Looking Towards 2010 • Refine nutrient cap load allocations to ensure achievement of the new state water quality standards • New sediment cap load allocations to ensure achievement of the water clarity/Bay grass standards • Partners must address Virginia TMDL court settlement and scheduled Maryland tidal water TMDLs by 2010
Chesapeake Bay Program- New Models Nitrate and ammonia deposition from improved Daily Nitrate and Ammonium Concentration Models Adjustments to deposition from Models-3/Community Multi-scale Air Quality (CMAQ) Modeling System Phase 5 Watershed Model Better year-to-year simulation – mass balance modeling; Large aggregate land simulation with distributed rivers; Time series of management practices; Automated calibration Chesapeake Bay Estuary Model New grid; Bank loads; Nutrient controls on TSS and chlorophyll-a sinking/suspension; Hydrodynamic and Wave Models for sediment re-suspension in the Water Quality Model
Partnership at Work Towards 2010 • 2006: states’ impaired waters lists updated, new Bay chlorophyll a criteria published, partners continue adopting new BMPs • 2007: new Bay watershed model, 2030 projections adopted, refinements to state WQ standards adopted • 2008: new Bay water quality/sediment transport model; states’ updated impaired waters lists drives decision on watershed-wide TMDL
Partnership at Work Towards 2010 • 2009: partners agreement on draft revised nutrient and sediment cap load allocations, initiate public review of new allocations and draft revised tributary strategies • 2010: partner approval of revised nutrient and sediment cap load allocations, state adoption of revised tributary strategies
Dissolved Oxygen Standards Attainment During June -September when water quality is poorest % total volume meeting dissolved oxygen standards Restoration Goal (100%) 57% of dissolved oxygen goal achieved.
Water Clarity Standards Attainmentas measured by Bay grasses and clarity Bay Grass Acreages Water Clarity
Wastewater Treatment Enhancement: Nitrogen (% goal achievement) Wastewater Treatment Enhancement Goal achievement is measured relative to the 1985 base year and a load cap of 37.8 M lbs. nitrogen and 3.01 M lbs. phosphorus. By 2004, 61% of the nitrogen goal and 80% of the phosphorus goal had been achieved. Wastewater Treatment Enhancement: Phosphorus (% goal achievement)
Tracking Reported Implementation of Agricultural Practices Agriculture Nitrogen Goal achievement level is an integration of implementation levels of agricultural BMPs reported by the states. Implementation is measured against Tributary Strategy goals with 1985 as the base year. Gray bars indicate a linear progression between years where data was available. By 2004, 44% of the nitrogen implementation goal, 49% of the phosphorus implementation goal, and 41% of the sediment implementation goal had been achieved. Agriculture Phosphorus Agriculture Sediment
Our Rivers Are Showing Signs of Progress When River Flow is Accounted for Sources: CBP, USGS
Rich Batiuk Associate Director for Science U.S. Environmental Protection Agency Chesapeake Bay Program Office 410-267-5731 batiuk.richard@epa.gov www.chesapeakebay.net