Exploring Information Systems Design and Taxonomy in Real-world Contexts
Learn about classification systems' impact on email filtering, drug policies, and CEMS portal development with visualization tools like Graphviz. Dive into case studies, models, and user-centric design strategies for effective ISD.


Exploring Information Systems Design and Taxonomy in Real-world Contexts
E N D
Presentation Transcript
Information Systems Design 3 Term 2
Topics • Classification and taxonomy in the news • Problem-centred approach • Term 2 topics • Visualization with Graphviz
Taxonomy in the news - Spam • ITS now use SpamAssassin for email filtering • False positives (classifying a good message as Spam) is much worse than False Negatives (spam getting through) • Multiple rules for classification: • ‘fuzzy logic’ : rules are assigned scores, based on accuracy, combined to produce an overall score for each message – if over a user-defined threshold, the mail is judged to be spam. • Default setting – 9% FNs, 0.6% FPs • http://eu.spamassassin.org/index.html
Taxonomy in the news - Cannabis • From Thurs 29th Jan. Cannabis is to be reclassified from Class B ( with amphetamines and barbiturates) to a class C drug (with tranquillizers) • Classification determines maximum penalties for possession and supply • Classification also carries implied meanings about enforcement, social acceptability and safety. • New classification of penalties – under 18 and over 18 • http://www.timesonline.co.uk/article/0,,8122-974552,00.html
A portal for CEMS • Member of group investigating an intranet for CEMS • ??
One System - Many systems • Multiple system boundaries: • Technical systems • The pages, the server software, the DB • The site in the context of the web of links, search engines • Social systems • The site in the context of the owner’s business • The site in the context of the customer’s activity • Ecological systems • Site, and the business evolving to find its own, viable niche within the evolving business/community world
Tutorial work • Ongoing case study • A web portal for CEMS students and staff • Discussing readings and the questions you might be asked in a exam about the reading. • Techniques applied to case study • Scenarios and use cases • Data quality evaluation • Data modelling • Visualisation
Readings • Christopher Alexander ‘Goodness of Fit’ from Notes on the synthesis of Form • Christopher Alexander – excepts from ‘A Pattern Language’ • Eleanor Wynn – ‘Taking Practice Seriously’ from Design at Work: Cooperative design of Computer Systems ed Joan Greenbaum and Morten Kyng • Donald Norman – The Mackintosh Power Switch – Bringing Design to Software • … • Martin Fowler ‘Accountability Patterns’ from Analysis Patterns : reusable Object Models • Michael Jackson – ‘Problem Frames’
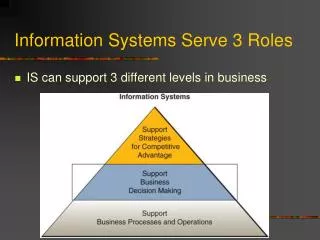
Term 2 topics • What is the scope of ISD? • An IS as a socially embedded system • User-centred design • Data quality • An IS as a formal technical system • formal models • recurrent data patterns • Closing the gap • Viewpoints, frames • Scenarios and use cases • Business process modelling • IS as an evolving system • Usage analysis • Learning systems • Reflection • ISD as social practice
CEMS Portal - 1 • How to start? • Which system boundary(s) to start with? • What development approach would be suitable?
CEMS Portal - 2 • EXERCISE NOW: • Who are the stakeholders?
CEMS Portal - 3 • What classification/taxonomy underpins your answer? • What is being classified – people, roles? • Which groupings make sense? On what basis?
The current system • One way of describing the current system is to model the site as pages and links between pages: a map of the site. • We can draw the map by hand or • We can use a package called ‘Graphviz’
Visualisation with Graphviz • Package of programs from AT&T • Lays out a directed or undirected graph from a textual description • DOT – directed graphs • NEATO – undirected graphs • Many uses in design • Site map • ER model from text
Undirected Graph graph ebis { top [shape=triangle]; top -- drugs; top -- housing; top -- finance; top -- travel; top -- education; top -- health; drugs -- aids; drugs -- heroin; drugs -- cannabis; health -- aids; } Unix command: /pub_domain/GraphViz/bin/neato -Tjgp < ebis.txt > ebis.jpg
Directed graph digraph perdika { index [URL="http://www.perdika.co.uk"]; index -> spec; index -> details; index -> story; spec -> index [style=dotted]; spec -> details; spec -> story….. /pub_domain/GraphViz/bin/dot -Tgif < perdika.dot > perdika.gif