Uniform Motion
Learn about uniform and non-uniform motion, instantaneous velocity, position vs. time graphs, velocity vs. time graphs, acceleration, and more through detailed examples and observations. Improve your understanding of motion analysis.


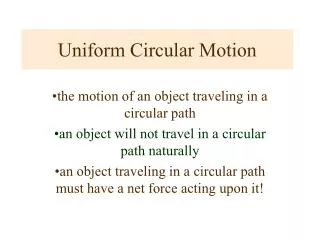
Uniform Motion
E N D
Presentation Transcript
Uniform Motion t = 1 s t = 0 t = 2 s t = 3 s t = 7 s t = 4 s t = 5 s t = 6 s t = 8 s
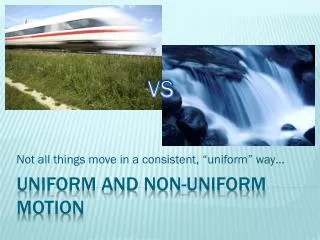
Non-uniform motion t = 1 s t = 3 s t = 9 s t = 0 t = 2 s t = 4 s t = 5 s t = 8 s t = 6 s t = 7 s
What is the velocity at t = 5.5 s? t = 1 s t = 3 s t = 9 s t = 0 t = 2 s t = 4 s t = 5 s t = 8 s t = 6 s t = 7 s • All we know from the given data is the average velocity between t = 5.0 and t = 6.0 s. • Measure the object’s position at a smaller time interval, like t = 5.4 s and t = 5.6 s. • Better yet, use t = 5.49 s and t = 5.51 s. • The velocity at the instant t = 5.5 s is approximately equal to the average velocity during a small time interval from t = 5.49 s to t = 5.51 s. But the best we can do with the given data is guess. PHY211 Dr. Aaron Titus
Instantaneous Velocity • The velocity at an instant of time is called instantaneous velocity. • It is approximately equal to the average velocity measured during a very small time interval.
Position vs. time graph -Slope of a tangent line on an x vs. t graph is instantaneous velocity. -Sign of slope (pos or neg) is direction of motion. -How slope changes tells you whether it is speeding up or slowing down.
Example Describe the motion of the object whose x vs. t graph is shown below.
Example Describe the motion of the object whose x vs. t graph is shown below.
Velocity vs. time graph -Slope of v vs. t graph is acceleration. -acceleration is the rate that the object speeds up or slows down. -if slope is constant, then the motion is characterized by constant acceleration
Example Describe the motion of the object whose v vs. t graph is shown below.
Example Describe the motion of the object whose v vs. t graph is shown below.
Example Describe the motion of the object whose v vs. t graph is shown below.
Observations If the object’s velocity is positive and the object speeds up, its acceleration is: positive negative zero
Observations If the object’s velocity is positive and the object slows down, its acceleration is: positive negative zero
Observations If the object’s velocity is negative and the object slows down, its acceleration is: positive negative zero
Observations If the object’s velocity is positive and the object speeds up, its acceleration is: positive negative zero
Matching position and velocity graphs Note what is being plotted in a given graph. Describe the motion in words or with a diagram. Sketch (or match) the graph that matches the motion diagram or verbal description of the motion.
The graph at left shows a moving object’s velocityv vs clock reading t. One of the graphs below shows the object’s positionx plotted vs t over the same time interval. Which one is it? v 0 t A B C x x x 0 0 0 t t t D E x x 0 0 t t