Download
1 / 67
680 likes | 952 Vues
GIS 5306 GIS in Environmental Systems. Week 2: Some more Theory, then Rudimentary Species Distribution Modeling: Habitat Suitability Models and Logistic Regression. Last Time. Intro and Logistics Main Questions How are organisms distributed on the surface of the Earth, and why?

E N D
GIS 5306 GIS in Environmental Systems Week 2: Some more Theory, then Rudimentary Species Distribution Modeling: Habitat Suitability Models and Logistic Regression
Last Time • Intro and Logistics • Main Questions • How are organisms distributed on the surface of the Earth, and why? • As Earth’s environment changes (climate, land use, geomorphologic, geologic, biologic), how will the distribution of organisms change? • Species Distribution Maps: Basic unit of Biogeography • Dot maps • Outline maps • Contour maps • Hybrids • Physical Factors (Abiotic Environment) of species distributions • Ecological Foundations of species distributions Population growth – intraspecies interactions Interspecies interactions Dispersal, extinction not dealt with
First: Project Options • Either a) the class or b) each student (or student team) will develop a research question (or questions). • Each student will argue for a taxon or group of taxa to study, including the study area (Florida gets highest priority?). • When 1&2 are decided, Each student will then learn, evaluate, and teach one or more methods for studying the taxa to answer the research question to the class.
Option b • When the methods have been examined, the class will decide the best methods and data required to answer the original research question. • Then the whole class will conduct various aspects of the analysis (comparison of multiple methods?). • Then we will write the paper, and submit it to an appropriate journal.
Pre-project exploration • Each student (or team of 2 depending on the final size of the class) will become familiar with one or two of the methods for species distribution modeling, then present the theory of the method, the software for the method, and an example “laboratory exercise” to the class, including providing data for the exercise. This can be the tutorial produced by the developer of the software, or an exercise developed by the student(s).
Work Assignments • Instructor will conduct next week’s class: • Theory of predictive vegetation mapping (subset of Species Distribution Modeling) • Selection and description of one method for predictive vegetation mapping (Habitat Suitability) • Tutorial for working through a Habitat Suitability example. • Provision of data for working up several examples. • Read the assigned papers linked on the syllabus.
Methods from which to Choose (See Class References) • Habitat Suitability Modeling (Binford) • Gradient Analysis (Ordination) methods (surprisingly not a major part of the literature) • Logistic Regression • Fuzzy Set Approaches (also more seen as part of habitat suitability modeling) • Biodiversity Informatics Facility – compilation of multiple software sites: • http://biodiversityinformatics.amnh.org/index.php?section_id=105&content_id=345 • DMAP – distribution mapping software • http://www.dmap.co.uk/ • MAXENT (Tutorial Available) • http://sourceforge.net/projects/maxent/, http://www.cs.princeton.edu/~schapire/maxent/ • GARP • http://www.nhm.ku.edu/desktopgarp/ • Openmodeller (multiple methods) • http://openmodeller.sourceforge.net/index.php?option=com_frontpage&Itemid=1 • http://www.springerlink.com/content/n805714x26265573/ • http://mac.downloadatoz.com/openmodeller-desktop/ • R-forge contributions for Species Distribution Modeling • https://r-forge.r-project.org/R/?group_id=697 • Land-change Modeler for IDRISI and ArcGIS • http://clarklabs.netkeepers.com/products/Land-Change-Modeling-IDRISI.cfm • Free GIS: DIVA-GIS: http://www.diva-gis.org/
Distribution of Species – Main Points • Individuals of each species have ecological requirements and limits that, along with historical factors, determine distribution. • Physical environmental factors create gradients of tolerance and optimality for organisms. • E.g. water, light, pH, temperature, salinity, etc. • Biotic environment (other organisms) also create gradients of tolerance and optimality. • Population growth (intraspecific interactions) • External (predation, competition, mutualism) • Internal (pathogens, parasites)
New Topic: Distribution of Species – Secondary Points • Interactions of physical and biotic factors always occur. • Very difficult to demonstrate mechanisms of distribution limitation, but straightforward to show correlations among physical and biotic factors and distributions.
The Niche Also implies that there can be multiple, or combinations of limiting factors
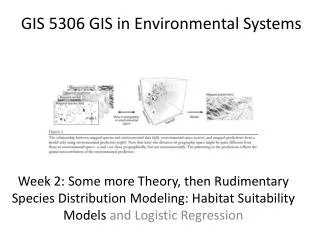
All Models Follow the Same Principle Mapping from species and environmental factor distribution (Geographic Space), modeled in Environmental Space, and re-mapped into Geographic Space Figures from Elith and Leathwick 2009
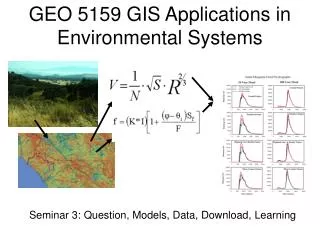
Another Way to Look at it. Theory Candidate variables Scale Sample Design Species occurrence data Environmental Data Validation Modeling Framework Map of predicted occurrence Redrawn from Franklin, J. 2009. Mapping Species Distributions. Cambridge.
This Time • A little more general theory • Binford: Rudimentary SDM. • Habitat Suitability/Cartographic Overlay • National Fish and Wildlife Service/Agency • Wildlife-habitat relationship (WHR) models • GAP Analysis Project • Workshop: Swallow-tailed Kite in North-central and northwest Florida.
Predictive vegetation mapping: Franklin 1995 • Fundamental paper reviewing practice to 1994; 30 papers! • Principles of Predictive Species Distribution Modeling (PSDM) • Predictive Vegetation Mapping • Habitat Modeling • Dependence of predictive vegetation mapping on ecological niche theory and gradient analysis • Cited by 363 more recent papers as of 30 August 2010
Definition: Predictive vegetation mapping by Climate Envelopes • Predicting the vegetation composition across a landscape from mapped environmental variables. Bald Cypress Longleaf Pine Species-by-species Live Oak
Longleaf Pine – Niche Graph and Importance Value Map http://www.nrs.fs.fed.us/atlas/tree/niche_121.html
Gradient Analysis and Continuum Concept (Whittaker 1951) • Whittaker 1973 continuum concept more explicitly puts forth hypotheses about species response functions (curves) to environmental gradients, e.g., that they are Gaussian.
Predictive vegetation mapping: Modeling • Always starts with the development of some type of model, followed by the application of that model to a geographic database to produce the predictive map, a realization of the model. Franklin 1995
Foundations and Premises • Predictive vegetation mapping is founded in ecological niche theory and vegetation gradient analysis. • Premise: vegetation distribution can be predicted from the spatial distribution of environmental variables that correlate with or control plant distributions. Franklin 1995
Pragmatism • Further, maps of the environmental variables or their surrogates must be available, or easier to map than the vegetation itself, in order for predictive vegetation mapping to be a practical or informative exercise. Franklin 1995
Model Foundations • In order to extrapolate over space (predictive vegetation mapping) or time (vegetation change modeling), direct gradients or their surrogates must be mapped (temperature, potential solar radiation, precipitation, soil-moisture availability, geology or soil chemistry).
Spatial Focus • Focus on the prediction of plant species distributions or vegetation patterns at the 'regional' scale, e.g., where the mapped extent of the predictions are generally at or within the biogeographic range of the dominant plant species. Franklin 1995
Models from Franklin 1995 • Boolean • Statistical Methods • Regression • GLM • GAM • Logistic (Logit) • Baysian • MONOMAX • Maximum Likelihood Classification • Rule-based Methods • Multivariate Methods • Discriminant analysis • Canonical correlation • Classification Trees • Neural Networks • Decision-tree Classification • Genetic Algorithms
Potential Vegetation vs. Actual Vegetation • Figure 1 Conceptual model showing the relationship between direct gradients (nutrients, moisture, temperature), their environmental determinants (climate, geology, topography) and potential natural vegetation, and the processes that mediate between the potential and actual vegetation cover (the latter is sensed by a remote sensing device). • Franklin 1995 page 479
Austin, M.P. 2002. Spatial prediction of species distribution: an interface between ecological theory and statistical modelling. Ecological Modelling 157:101-118. • Cited by 495
Rudimentary SDM: Habitat Suitability/Cartographic Overlay • Goes back to McHarg 1969: Design with Nature
Suitability for Ski Areas Not drinking water Slope between 5% and 75%; Aspect N, W, E Soils not erodible, not high runoff Vegetation Vegetation: grass, degraded forest Biodiversity Biodiversity low Areas suitable for ski areas
Site Suitability Analysis, or Multi-Criteria Evaluation This project aimed at identifying the best area suitable for development of a ski resort in Mitchell and Yancey Counties in NC. The following factors were included in the suitability analysis: Land cover, access, snow precipitation, land ownership, elevation, aspect and slope. Areas Suitable for Ski Resort Development http://gis.ncsu.edu/research/tourism/GIS_Tourism_Projects.htm
Works for SDM/Habitat Modeling, too • What are habitat requirements for • Single species • Multiple species • Vegetation communities, assemblages • Biodiversity • SCALE ISSUE • Dot maps vs. area maps. Fine vs. coarse scale • Depends on question!
Animal Species Distribution Modeling – Habitat Suitability/Wildlife-Habitat Relationship (WHR) Models • GAP Analysis Project: “Keeping Common Species Common” • Where are the gaps in biodiversity protection? http://gapanalysis.nbii.gov/portal/server.pt
Research/Management Question • How well are we protecting common plants and animals? • Corollary: if we are not protecting them well, what can we do about it? • Land-use planning • Conservation purchases and easements • Originallynot “common species” but “biodiversity.”
GAP Procedure • 1. Map LAND COVER of the dominant ecological systems • 2. Map and model SPECIES ranges and distributions • 3. Map land STEWARDSHIP • 4. Conduct the ANALYSIS • All from http://gap.greeninfo.org/
GAP ProceduresNote WHRM is an associational database: what animals would be expected to be found in vegetation alliance (habitat). Qualitative! From Complete GAP Handbook available from ftp://ftp.gap.uidaho.edu/products/handbookpdf/CompleteHandbook.pdf
Florida GAP http://www.wec.ufl.edu/coop/gap/lcmapping.htm Data available at FGDL data repository www.fgdl.org
Definition: Habitat Modeling • Habitat • where and animal lives • the living and non-living characteristics of a landscape that an animal uses • what animals need to survive and reproduce • Different kinds of habitat: Food, water, hiding cover (prey) or ambush cover (predators), thermal cover (against heat or cold or both), and nest sites (or other special needs for reproduction), the minimum amounts and spatial arrangement of the first 5 components
Habitat Modeling • Expert opinion • Literature • Compilation into database • What should occur where • Absences difficult to model • Database query • What collection of vertebrates should be in what vegetation alliances? • Calculate biodiversity hotspots • Stewardship determination • What is not already protected? • Considers management objectives of public agencies
Gaps Identified! • Now what? http://gapanalysis.nbii.gov/portal/community/GAP_Analysis_Program/Communities/Maps,_Data,_&_Reports/Find_Updated_GAP_Regional_Data/
Animal Species Distribution Models – Habitat Suitability Indices • US Fish and Wildlife Service http://www.nwrc.usgs.gov/wdb/pub/hsi/hsiintro.htm
Habitat Suitability Modeling; Wildlife-Habitat Relationship Models: Theory • Habitat suitability index (HSI) model is intended for use with the habitat evaluation procedures (HEP) developed by the U.S. Fish and Wildlife Service (1980) for impact assessment and habitat management. The model was developed from a review and synthesis of existing information, and includes unpublished information that reflects the opinions of persons familiar with black-shouldered kite ecology. It is scaled to produce an index of habitat suitability between 0 (unsuitable habitat) and 1.0 (optimally suitable habitat). • This model is a hypothesis of species-habitat relations, not a statement of proven cause and effect. The model has not been field tested.
HIS: Theory – All from literature or experts • Distribution and commercial importance • Life history overview • Habitat requirements • Food for both adults and immatures (and associated habitat) • Cover for both adults and immatures • Breeding habitat (e.g. nesting) if different • Geographic area and season • Minimum habitat area
Example Habitat Suitability Index: American Alligator (Alligator mississippiensis) • The American alligator is characteristically a resident of river swamps, lakes, bayous, and marshes of the Gulf and Lower Atlantic Coastal Plains from Texas to North Carolina. • HSI publications have standard format: • INTRODUCTION • Distribution and Commercial Importance • Life History Overview • HABITAT REQUIREMENTS • food • Cover • HABITAT SUITABILITY INDEX (HSI) MODEL • Model Applicability • Model Description • Suitability Index (SI) Graphs for Model Variables • Component Index (CI) Equations and HSI Determination • Field Use of Model • Interpreting Model Outputs • REFERENCES http://www.nwrc.usgs.gov/wdb/pub/hsi/hsiindex_byauthor.htm
American Alligator HSI Model If all of these components can be mapped in a GIS, then the map of habitat suitable for alligators can be produced.
American Alligator HSI Model If all of these components can be mapped in a GIS, then the map of habitat suitable for alligators can be produced.