Download

1 / 29
290 likes | 430 Vues
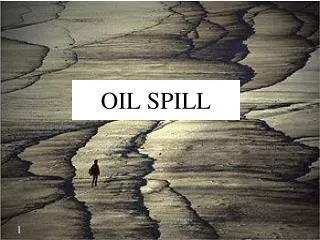
NOAA ’ s National Ocean Service • Office of Response and Restoration. Use of Operational Forecast Systems in Oil Spill Trajectory Modeling. Amy MacFadyen and Glen Watabayashi Emergency Response Divison , NOAA/NOS/OR&R. Outline.

E N D
NOAA’s National Ocean Service • Office of Response and Restoration Use of Operational Forecast Systems in Oil Spill Trajectory Modeling Amy MacFadyen and Glen Watabayashi Emergency Response Divison, NOAA/NOS/OR&R
Outline • About the Emergency Response Division (formerly NOAA HAZMAT) • Physical processes in oil movement • Trajectory forecasting of oil spills • Use of (operational) Nowcast/Forecast systems
Origins of NOAA HAZMAT program 1976 Argo Merchant • On December 15, the tanker grounded near Nantucket Island over Georges Bank carrying ~7.5 million gallons of heavy fuel oil • NOAA began its first major coordinated oil spill response activity NOAA Hazardous Material Response Division was created to provide scientific expertise during a response incident
Origins… 1989 Exxon Valdez • March 24 grounding in Prince William Sound resulting in spill of 11 million gallons of crude oil • NOAA HAZMAT team supported the massive cleanup and damage assessment by providing forecasts, guiding aerial obs, making recommendations on cleanup actions and monitoring recovery Prompted congress to enact the Oil Pollution Act (OPA) of 1990 giving NOAA greater ability to respond to spills and creating a trust fund financed by oil tax to aid in cleanup operations
Emergency Response Division • under the National Contingency Plan, NOAA has responsibility for providing scientific support to the Federal On-Scene Commander (FOSC) for oil and hazardous material spills • ERD provides 24-7 response to spill events • ERD’s scope encompasses the entire U.S. coastline, including the Great Lakes, Alaska, Hawaii and U.S. territories
Incident Command Structure • Scientific Support Coordinators are staff advisors to Federal On-Scene Commanders responsible for coordinating the scientific aspects of spill response • a team of ERD scientists, support the SSCs during spill events, as well as in drills and contingency planning • shoreline assessment, biological and resource assessment, weather forecasts, overflights, data management, communications, protection/cleanup recommendations and priorities
What happened? Where will it go? What will it hit? How will it hurt? What can be done?
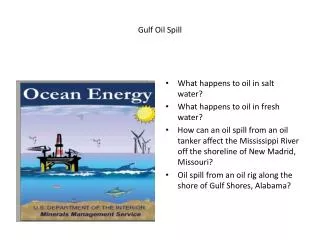
What happens to oil spilled at sea? • Oil spill trajectory forecasts must consider the physical processes describing both the fate and the transport of oil released into the environment • Spreading • Advection • Dispersion and mixing • Weathering From ITOPF report (www.itopf.com)
Processes in Oil Weathering hours • Spreading • Evaporation • Dispersion • Dissolution • Emulsification • Photo-oxidation • Sedimentation • Biodegradation days weeks years time
Transport processes • horizontal advection • Surface currents and wind drag • empirical studies demonstrate that surface slicks are transported with the surface current at 3-4% of the wind speed • oil is dispersed horizontally by turbulence field • oil is also transported vertically in the water column in the form of droplets of various size • recent work has demonstrated that this vertical movement is important not only for mass balance calculations, but also in determining the spatial and temporal distribution of oil on the sea surface both vertical and horizontal current shears are important factors in the net motion of oil at sea
Trajectory forecastingADIOS2 + GNOME AK North Slope Crude Diesel Five day oil budget – 20 kt winds, 0.5 kt currents Showing amount evaporated, dispersed, remaining
Trajectory forecastingADIOS2 + GNOME • Lagrangian-Eulerian spill trajectory model • Spills are modeled as Lagrangian particles within continuous Eulerian fields • Surface wind effects (wave stress, wave compression, Stokes drift, dispersion, over-washing, surface drift and Langmuir circulation) are combined into “Wind Drift” parameter • Simple weathering algorithms • Limited 3D capability
Data sources for ocean currents--in house response model-- • linear, shallow water equations • barotropic • steady-state • easily relocatable and can be set up and run very quickly • simplified physics
Data sources for ocean currents--external forecast models-- • Navy operational models • NCOM, NLOM, HYCOM • NOAA operational models • NWS RTOFS Atlantic Basin model • CSDL/COOPS models • State agency run models • Texas General Line Office (TGLO) Gulf of Mexico • IOOS Regional Associations
ROMS models for US coastal waters producing Nowcast/Forecast currents Prince William Sound (JPL) Oregon (OSU) Mid Atlantic Bight (Rutgers) ROMS Hawai’i (UH) Southern CA Bight (JPL) Gulf of Mexico (TAMU/TGLO)
Considerations for use of currents from external models in trajectory forecasting Recent (March 2010) Examples from ResponseLink • Forecast for current/ongoing spills • Hindcast requests • Assessing threats from known sources • Assessing threats from hypothetical sources/spills
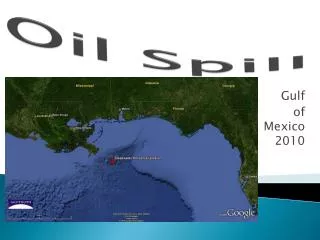
1. Response to current/ongoing spill Scenario: At approximately 1800 hrs on 25 March 2010, USCG Marine Safety Unit Morgan City notified the NOAA Scientific Support Coordinator of a 10 mile by 3 mile slick located roughly 20 miles SSW of Caillou Bay and the Louisiana Coast. The NRC Report stated that 951 bbls spilled based on an estimation (probably based on a sheen calculation for dark oil). 951 bbls = ~40,000 gallons
1. Response to current/ongoing spill Response: In the first hour of the spill: • Weather forecast, tide forecast, oil fate prediction • Initial trajectory passed verbally by phone and followed by written report 2 - 4 hrs after initial call: • Computer model setup and run • Forecast 24-48 hours Day 2 after initial call • Away Team goes on-scene • Model recalibrated and run daily Considerations for using currents from operational model • Access – immediately available at any time • Format – easily loaded into GNOME • Validation – should we believe the forecast • Point of contact – is there someone we can call with questions
1. Response to current/ongoing spill TGLO ROMS model • Developed at TAMU and run operationally by TGLO • Forecast images and data easily available through website • Output is available in GNOME ready format http://seawater.tamu.edu/tglo/rindex.html
2. Hindcast requests – “Where did this [body, dead whale, medical equipment, bale of cocaine…] come from?” Scenario: On 18 March 2010, NOAA Emergency Response Division was notified by USCG Sector Guam, via email, of tarballs coming ashore at Ritidian Point-on the island's northern end. (13° 39.5'N by 144° 51.8'W). NOAA Scientific Support Team was requested to provide a hindcast trajectory to help better evaluate possible sources. Specifically: what is the likelihood of pollution source originating from the northern islands?
2. Hindcast requests – “Where did this [body, dead whale, medical equipment, bale of cocaine…] come from?” Response: • Written analysis summarizing findings within ~24 hours Considerations for using currents from operational model • Access – usually not as urgent but may need previous several days • Format – have more time to make GNOME ready • Validation – may be able to corroborate model results with current meter or HF radar data
3. Potential threats from known sources Scenario: The SS Princess Kathleen is a well-known wreck in the Juneau area, which sunk on Sept. 7, 1952. From a time shortly after her sinking to today, she has been leaking fuel oil into the surrounding waters. Recent increases in the sightings of small oil blobs in the area of Lena Pt. resulted in Sector Juneau's decision to seriously evaluate the wreck for possible removal of the remaining fuel, which is very roughly estimated at 155,000 gallons of bunker C … Global Diving tentatively hopes to start pumping oil on or about March 5. NOAA has been asked to provide weather and trajectory support for this incident.
3. Potential threats from known sources Response: • Written analysis summarizing findings within days to weeks • Most likely impacted regions under typical (seasonal, event-scale) forcing scenarios • Worst case scenarios • Results may direct the field response – ie when is best time for pumping operations Considerations for using currents from operational model • Access – in order to do statistical analysis may need multiple years of output • Format – have time to make GNOME ready but may involve very large datasets • Validation – does model reasonably represent variability of real system
Utility of external models in spill response • Needs depend on type of request • In general, output must be rapidly accessible in standardized format • New technologies make this much less of a hurdle (e.g. NetCDF, NcML, OpeNDAP) • in most cases model output will still require some pre-processing before import into GNOME Stolen from Rich Signell
GOODS website • Inventory of accessible oceanographic and meteorological sources • Allows quick extraction, subsetting and produces output that can be quickly loaded into GNOME • Trajectory modelers can evaluate results from a suite of inputs and generate a consensus forecast • Uncertainty estimates
Summary • Proliferation of Nowcast/Forecast models, observing system components and new technologies enabling interoperability increasingly allow us to use multiple model and data sources for oil spill trajectory forecasting • Using output from state-of-the-art regional models is possible during early stages of spill response only if contacts have been made prior to the spill
Mahalo! http://www.weather.com