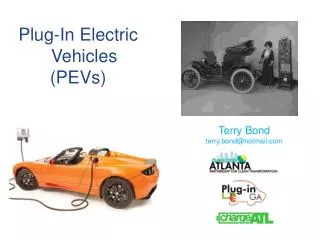
Plug-in Electric Vehicles
110 likes | 240 Vues
This document presents a comprehensive overview of plug-in electric vehicles (PEVs), tracing their historical roots back to Detroit's electric taxis in 1914, and highlighting advancements in electric drive technologies. It discusses various types of electric vehicles, including Battery Electric Vehicles (BEVs) and Plug-in Hybrid Electric Vehicles (PHEVs). Key factors influencing the adoption of PEVs, government policies, energy security, and environmental benefits are examined. The report also addresses the challenges faced by electric vehicle infrastructure and potential solutions by industry leaders.

Plug-in Electric Vehicles
E N D
Presentation Transcript
Plug-in Electric Vehicles David Ellis May 20, 2010 AABE National Conference
In 1914, Detroit was the first American city to use electric taxi cabs Detroit’s first electric taxi accumulated more than 46,000 miles in its first two years of operation. Note the curb-side charging port and main charging stations.
Electric drive technologies Internal Combustion Engine (ICE) Hybrid Electric Vehicle (HEV) Plug-in Hybrid Electric Vehicle (PHEV) Extended Range Electric Vehicle (EREV) Battery Electric Vehicle (BEV) Motor Differential Differential Differential Motor Plug-in Electric Vehicles (PEV) Today Mechanical Coupling Mechanical Coupling Transmission Batteries Batteries Motor Transmission Transmission Motor Engine Generator Batteries Batteries Engine Engine Engine Miles Electric only: 10-20 ~40 100+ Larger battery and less emissions
Electric drive technologies and annual electricity consumption Annual Electricity Usage per Vehicle* (kWh) • 75% of Americans drive less than 40 miles on their daily commute • 40 miles electric only - achieves similar GHG reduction as BEV- Limited need for public charging • BEVs will require faster charge rates and more daytime charging to address range “anxiety”- Needs public charging infrastructure * Assumes a vehicle drives 12,500 miles / day, PHEV and EREV electric usage varies depending on drive characteristics, Chevy Volt-type vehicle at 5 mi/kWh
In addition to technology advances, multiple factors are aligning to support a successful launch of PEVs U.S.A. Rest of World Policy $2.4 Billion in U.S. stimulus dollars directed at advanced automotive batteries European Union target of 95 grams of CO2/km by 2020 => 60 mpg Climate Significant activity in Washington on federal climate legislation China’s commitment to building 500,000/year hybrid and electric vehicles by 2012 Energy Security Push for a domestic fuel source and fear of the return of high gas prices Urban smog in emerging mega-cities
but for now, disadvantaged on purchase price Plug-ins have a big fuel cost advantage … US example Fuel Cost Comparison*($/Mile) … but BIG upfront premium today $12,500 - $17,500 fuel savings over 10 years* ~$15,000 premium over regular car reduced by $7,500 tax credit * Gallon of gasoline equivalent price computed comparing ICE mileage of 26 mpg to PEV mileage of 5 mi/kWh at $0.10/kWh, 12,500 miles per year, undiscounted
Electricity drive reduces GHG emissions and our addiction to imported oil Freedom from petroleum: electricity a domestic resource 350 Future Nuclear, Wind, Solar, etc. Hybrid ICE Coal Natural Gas Gasoline Electricity (by source) * 204 lb/MMBtu CO2 emissions rate (no carbon capture), 9,500 heat rate coal plant, 7,500 heat rate natural gas plant, ICE engine at 26 mpg, Hybrid drivetrain between 30-45 mpg, electric motor at 5 mi/kWh Source: Argonne National Labs GREET Model, DTE Team Analysis
Infrastructure in place for broad PEV adoption ILLUSTRATIVE Impact of PEV on Typical Summer Load Profile (Ideal Case)* MW 10% market share** * PHEV is likely to also contribute to increased load during peak hours. Illustrative example of electric utility load – similar to Detroit Edison ** Estimated 600,000 cars and light trucks (does not include diesel trucks, buses, etc), 12,500 miles per year, 3.0 mi/kWh average efficiency, 75% electric operation Source: DTE analyses, EPRI/NRDC Report
Uncontrolled charging could lead to localized disruptions if not properly managed • Potential problems • Voltage dips (dimming lights, damage to expensive electronics) • Service interruption • Transformer failure • Measures to address these issues • On-vehicle charging control (time/date control) • Utility notified at time of PEV purchase • SmartGrid technology Load shape for warm summer day – adding 3 PEVs to a neighborhood 25 kVATransformer with Uncontrolled PEV Load* Peak Capacity Design Capacity` Summer Load3 PEV @ 1.4 kW3 PEV @ 3.3 kW *8-12 smaller, older homes per 25 kVA circuit. Most homes without central AC.
DTE is working with Ford, GM and Chrysler on real-world testing • Testing is focused on: • Battery technology • Vehicle systems • Customer usage • Grid infrastructure 2009 Ford Escape plug-in hybrid electric vehicle 2011 Chevy Volt