Download

1 / 44
440 likes | 490 Vues
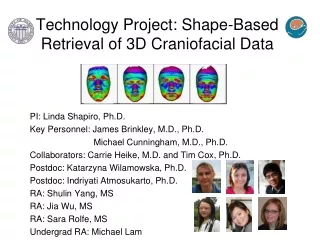
This dissertation explores shape-based quantification of 3D facial data for identifying 22q11.2 deletion syndrome, aiming to enhance disease detection accuracy by describing crucial facial features. The research objective is to develop a methodology for classifying affected individuals and quantifying dysmorphology. It investigates the subtle facial features of 22q11.2 deletion syndrome, emphasizing the importance of early detection due to associated cardiac anomalies, immune deficiencies, and learning disabilities. The study is motivated by improving the accuracy of genetic testing referrals, focusing on shape-based analysis with minimal human involvement. The project evaluates the recognition of dysmorphic faces using dense surface models and classifiers like SVM, LDA, and kNN. Multiple experiments are conducted to assess the performance of the developed methodology. Overall, the goal is to provide a robust automated system for detecting craniofacial genetic syndromes, contributing to the field of craniofacial research.

E N D
Shape-based Quantification of 3D Face Data for Craniofacial Research Katarzyna Wilamowska General Exam Department of Computer Science & Engineering University of Washington 2008 1
Motivation • Help detect disease more accurately • Describe useful features 3
22q11.2 Deletion Syndrome (22q11.2DS) • aka Velo-cardio-facial syndrome (VCFS) • affects approximately 1 in 4000 individuals in the US • early detection is important • cardiac anomalies • mild to moderate immune deficiencies • learning disabilities genetic test for 22q11.2DS 4
Profession # Sensitivity Specificity Geneticist 9 0.72 0.51 Speech Pathologist 13 0.72 0.52 Surgeon 10 0.64 0.50 Experts Looking at Photos Becker et al. 2004 • 14 affected, 10 control • one photo at infancy & one beyond 2 years old • Improve accuracy of genetic testing referrals 7
Research Objective • Develop a successful methodology to • classify 22q11.2 deletion syndrome affected individuals • quantify the degree of dysmorphology in facial features • Design consideration • Minimal human involvement 8
Related Literature • Medical Craniofacial Assessment • calipers, manual landmarks • CT, MRI, Ultra Sound, Stereoscopic imaging • Time consuming human involvement 9
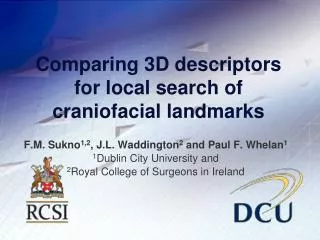
Related Literature • Computer Vision Craniofacial Analysis • 1D waveforms • 2D images, landmarks • 3D morphable models, new representations, landmarks • hybrid 2D/3D systems • Focus: biometric authentication and recognition 10
Recognition of Dysmorphic Faces Boehringer et al. 2006 input point labeling classify PCA feature extraction using wavelets 11
Recognition of Dysmorphic Faces Results • Classifiers: LDA, SVM, kNN, JV • Simultaneous classification • Manual 76% • Auto 52% => face localization • Pairwise classification • 89% - 100% 12
Dense Surface Models Hutton 2004 Hammond et al. 2005 Hammond 2007 calculate mean landmarks create dense correspondence to base mesh input warp to mean landmarks classify PCA unwarp trim surfaces average face 13
Data characteristics Classifiers Best 22q11.2 results 60 VCFS 130 control SVM, closest mean, Logistic regression, Neural networks, decision trees Sensitivity 0.83 Specificity 0.92 115 VCFS 185 control SVM, closest mean, linear discriminant analysis Accuracy Face 0.94 Eyes 0.83 Nose 0.87 Mouth 0.85 Dense Surface Models: 22q11.2DS Results 14
Boehringer et al Hutton et al My work Data representation 2D photographs 3D meshes 2D photographs 2.5D depth images curved lines Control data no yes yes Data labeling manual manual none [automatic] Clean up manual empirically determined threshold manual Final goal separate diseases distance from average facial features Comparison to Previous Work 15
Data Preprocessing: Pose Alignment 1st Attempt • Goal: Align each head to same orientation • Solution: Hand align with Iterative Closest Point (ICP) assistance Hand aligned After ICP
Data Preprocessing: Pose Alignment 2nd Attempt • Goal: Align each head to same orientation • Solution: Align using 1st principle component from PCA
Data Preprocessing: Pose Alignment Final Solution • Goal: Align each head to same orientation • Solution: Automatically calculate 3 rotation angles necessary to achieve goal Yaw Roll Pitch 19
Data Preprocessing: Yaw and Roll Alignment • Use symmetry to align for each rotation rasterize choose rotation angle that minimizes difference absolute value ( - ) = 20
Data Preprocessing: Pitch Alignment • Minimize difference between chin height and forehead height forehead chin nose upper lip lower lip 21
Data Preprocessing: Alignment Results • Better results if both Yaw and Roll are aligned together Original Yaw Roll Yaw and Roll • Pitch rotation can fall into local minimum due to top of the head Over-rotated After 1st iteration 22
Data Representation • 3D snapshot • 2.5D depth image • Curved lines 23
Data Representation 3D snapshot Whole head Cutoff at ears 24
Data Representation 3D snapshot Whole head Cutoff at ears 2.5D depth map 25
Data Representation 3D snapshot Whole head Cutoff at ears 2.5D depth map curved lines 26
Curved Lines Detail curved lines 27
Curved Lines Detail curved lines 28
Curved Lines Detail curved lines 29
Curved Lines Detail curved lines 30
Experiment Setup • 53 affected, 136 control individuals • Age range 10 months to 39 years • Data labeled status, gender & age • Goal: classify each individual as affected or control 31
System Diagram clean up automatic alignment facial feature selection and quantification classify PCA Naive Bayes 32
Experiments: Component Selection 10 months 10 years 30 years 33
Disease Positive Negative Test Positive TP FP Negative FN TN Statistical measures 34
Name #total (#affected) data set description ALL 189 (53) data collected from Children’s Hospital AS106 106 (53) each affected matched by gender, then closest age W86 86 (43) only affected labeled white matched by gender, then closest age Results: Balancing Data Sets 36
Expert Survey • 3 experts • quantify features • new insights 39
Comparison to experts F-measure Precision Recall Accuracy
Proposal for Continued Work • Distance from Average • Approximation using Ellipsoids • Creating new texture information • Assessing facial asymmetry • Automatic Landmarks • 3D Local features Global features Local features 41
Global FeatureDistance From Average • Data sets: curved lines, 2.5D • Separate by status, sex, age • Similar approach as Hutton, but no landmarks necessary 42
Global FeatureCreating New Texture Information • Average face • Gaussian curvature • Azimuth and elevation of normals • Geodesic information 43
Contributions • Fully automatic system • Facial pose alignment method • Different data representations for classification • Classification of 22q11.2DS affected individuals rivals experts 44