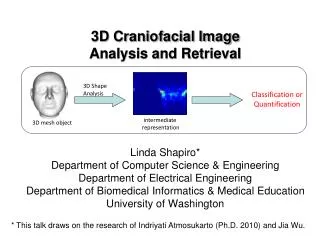
3D Shape Analysis for Quantification, Classification and Retrieval
3D Shape Analysis for Quantification, Classification and Retrieval. 3D Shape Analysis. 2D salient map. 2D histogram. GP tree. 3D mesh object. Indriyati Atmosukarto PhD Defense Advisor: Prof Linda Shapiro. 3D Shape Analysis. 2D longitude-latitude salient map. Learning

3D Shape Analysis for Quantification, Classification and Retrieval
E N D
Presentation Transcript
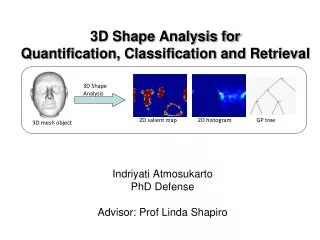
3D Shape Analysis for Quantification, Classification and Retrieval 3D Shape Analysis 2D salient map 2D histogram GP tree 3D mesh object Indriyati Atmosukarto PhD Defense Advisor: Prof Linda Shapiro
3D Shape Analysis 2D longitude-latitude salient map Learning salient points 2D azimuth elevation histogram Learning 3D shape quantification
Global 2D Azimuth-Elevation Angles Histogram • 3D Shape Quantification for Deformational Plagiocephaly • Classification of 22q11.2DS
3D Shape Quantification for Deformational Plagiocephaly • Discretize azimuth elevation angles into 2D histogram • Hypothesis: flat parts on head will create high-valued bins
Shape Severity Scores for Posterior Plagiocephaly • Left Posterior Flatness Score (LPFS) • Right Posterior Flatness Score (RPFS) • Asymmetry Score (AS) = RPFS - LPFS • Absolute Asymmetry Score (AAS)
Classification of Deformational Plagiocephaly • Treat 2D histogram as feature vector • Classify five plagiocephaly conditions
Classification of 22q11.2DS • Treat 2D histogram as feature vector
3D Shape Analysis 2D longitude-latitude salient map Learning salient points 2D azimuth elevation histogram Learning 3D shape quantification
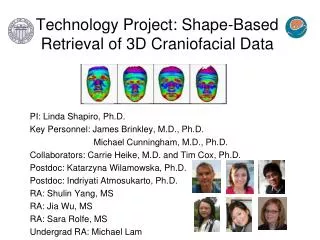
Learning 3D Shape Quantification • Analyze 22q11.2DS and 9 associated facial features • Goal: quantify different shape variations in different facial abnormalities
Learning 3D Shape Quantification -Facial Region Selection • Focus on 3 facial areas • Midface, nose, mouth • Regions selected manually
Learning 3D Shape Quantification -2D Histogram Azimuth Elevation • Using azimuth elevation angles of surface normal vectors of points in selected region
Learning 3D Shape Quantification -Feature Selection • Determine most discriminative bins • Use Adaboost learning • Obtain positional information of important region on face
Learning 3D Shape Quantification -Feature Combination • Use Genetic Programming (GP) to evolve mathematical expression • Start with random population • Individuals are evaluated with fitness measure • Best individuals reproduce to form new population
x y 5 + * 5*(x+y) Learning 3D Shape Quantification -Genetic Programming • Individual: • Tree structure • Terminals e.g variables eg. 3, 5, x, y, … • Function set e.g +, -, *, … • Fitness measure e.g sum of square …
Learning 3D Shape Quantification - Feature Combination • 22q11.2DS dataset • Assessed by craniofacial experts • Groundtruth is union of expert scores • Goal: classify individual according to given facial abnormality
Learning 3D Shape Quantification -Feature Combination • Individual • Terminal: selected histogram bins • Function set: +,-,*,min,max,sqrt,log,2x,5x,10x • Fitness measure: F1-measure X6 + X7 + (max(X7,X6)-sin(X8) + (X6+X6))
Learning 3D Shape Quantification - Experiment 1 • Objective: investigate function sets • Combo1 = {+,-,*,min,max} • Combo2 = {+,-,*,min,max,sqrt,log2,log10} • Combo3 = {+,-,*,min,max, 2x,5x,10x,20x,50x,100x} • Combo4 = {+,-,*,min,max,sqrt,log2,log10, 2x,5x,10x,20x,50x,100x}
Learning 3D Shape Quantification - Experiment 1 • Best F-measure out of 10 runs
Tree structure for quantifying midface hypoplasia ((X7-X7) + (X6+(((X6+X6)-X7)+(X7-X2)))+X7))+(X9-5X9+X7+X7) Xi are the selected histogram bins
Learning 3D Shape Quantification - Experiment 2 • Objective: compare local facial shape descriptors
Learning 3D Shape Quantification - Experiment 3 • Objective: compare GP to global approach
Learning 3D Shape Quantification - Experiment 4 • Objective: predict 22q11.2DS