Measurement, Quantification and Analysis
Measurement, Quantification and Analysis. Some Basic Principles And Some Basic Statistics. Three Major Issues. Biological and especially ecological data show high variability in quantitative traits

Measurement, Quantification and Analysis
E N D
Presentation Transcript
Measurement, Quantification and Analysis Some Basic Principles And Some Basic Statistics
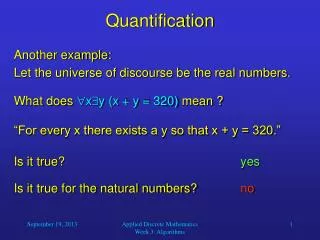
Three Major Issues • Biological and especially ecological data show high variabilityin quantitative traits • We almost never measure everything in field research; rather we samplefrom larger populations or data sets • Sampling leads to uncertainty about conclusions, so we always must estimate our uncertainty • Items 1) – 3) above are why we use Statistics!
Continuous data All natural processes are variable, Whether continuous or discreet Discreet data Plus, better sampling effort better describes distributions
In many processes, we observe characteristic distributions 37.5% (p + q)4 where p = q = 0.5 When (p + q) is raised to the 20th power, binomial is indistinguishable from the normal. Binomial – Few interacting factors Normal – Many interacting factors 2 factors: One way to get AA or aa, 2 ways to get Aa (p + q)2 4 factors: One way to have AAAA or aaaa, 4 ways to get AAAa or aaaA, and 6 ways to get AAaa
Major point: Biological processes are variable, but they often tend to vary in predictable of consistent patters.
A characteristic of field biology is the attempt to estimate parameters from highly variable populations of uncertain “true” value. To calculate the average in a sample: Mean = Sum of all observations/number of observation To estimate the variability of the observations: Variance = Sum of (individual observation – Mean of observations)2 _____________________________________________ Number of Individual Observations - 1 -1 Or to express this in the same units as the Mean: Standard deviation = Square Root of the Variance
All natural processes are variable, Whether continuous or discreet What happens when we estimate means? Select 5 observations at random. Then 10. Then 25. Probability • Better sampled populations yield better distributions • Larger sample sizes yield better estimates • Means will also be variable, and will have a characteristic distribution • If you sample N means, they will have a variance as well
To estimate the variability of the means: Divide the standard deviation (the square root of the variance) by the square root of the sample size (why? Variability of the means is dependent upon sample size – decreases with large samples.) Recall, To estimate the variability of the observations: Variance = Sum of (individual observation – Mean of observations)2 _____________________________________________ Number of Individual Observations – 1 To estimate the variability of the means: Divide the square root of the variance, the standard deviation, by the square root of the sample size. The bigger the sample size, the less variable the means This is the Standard Error, which is used to calculate a Confidence Interval
If you want, for example, a 95% confidence that a mean measured was from this theoretical distribution, you want to multiply the standard error by a constant the grabs 95% of the distribution. Note that plus or minus 2 SE gives you 4.26% (2.13 x 2), so it needs to be a little smaller, 1.96 to be precise.
Confidence intervals represent a level of confidence about the true value of the mean. It is the mean, with the expected variability (standard error) combined with a constant derived from a theoretical distribution that defines how much uncertainty is acceptable. Lets pick a constant that circumscribes 95% of the variability. In other words, if you sample repeated with a given sample size, a 95 % CI means that in 95% of the samples you collect, you will have the value of the true mean. The mean is either in or not! • No matter how well we sample, we will “miss-estimate” the population parameter a certain percentage. • What level of error are we willing to accept? • With a 95 % limit, 5 % of the time. • In theory, the tails are limitless, so we must set a criterion. • Decision rule – 5 % error. • Minimize this with replication
Importance of Replication? One sample: Wrong 5% or 1/20 of the times you sample Two replicated samples: Wrong 1/20 x 1/20 or 1/400 Three replicated samples: Wrong 1/20 x 1/20 x 1/20 or 1/8,000
What confidence do we want? What error will we accept? One things we do frequently in science is compare things. For example, if one population bigger than another, which population are we sampling from? A B What kinds of errors can we make?
Fundamental Principles • Have clearly defined hypotheses • Measure carefully • Sample intensively – large sample sizes reduce Beta-Error • Replicate – Replication reduces Alpha-Error
Samples of Data Sets from Previous Projects that required Quantification and Statistical Analysis