Download
1 / 34
360 likes | 451 Vues
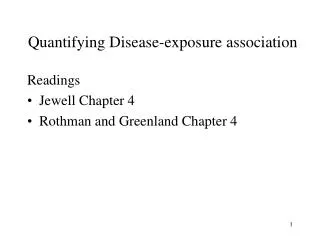
Basic epidemiological study designs and its role in measuring disease exposure association. M. A. Yushuf Sharker Assistant Scientist Center for Communicable diseases Icddr,b yushuf@icddrb.org. Measures of Disease Exposure Association.

E N D
Basic epidemiological study designs and its role in measuring disease exposure association M. A. Yushuf Sharker Assistant Scientist Center for Communicable diseases Icddr,b yushuf@icddrb.org
Measures of Disease Exposure Association Does coffee drinking affect the risk of pancreatic cancer? Coffee drinking is the exposure (E) or risk factor measured in binary scale Exposed = E = 1 Not exposed = E’ = 0 Pancreatic cancer is the disease outcome (D) also measured in binary scale Disease = D = 1 Not Disease = D’ = 0 We are interested in the association between the risk factor and disease
Data • We have collected information from the sampled individuals and arranged in the following table
Excess Risk (ER) • -1 ≤ ER ≤ 1 • ER = 0 is the null value, D and E are independent • ER > 0 indicates greater risk of disease when exposed than when unexposed • ER < 0 is the lower risk of disease • ER is the excess number of cases as a fraction of the population size when population members are all exposed compared to them all being unexposed
Example: Excess Risk (ER) Risk of Pancreatic cancer associated with coffee drinking is .07 Or, We would expect the pancreatic cancer increase by 7% as all people appear as coffee drinker compared to all people being non-coffee drinker
Relative Risk (RR) • RR is always non-negative • RR = 1 is the null value • RR > 1 indicates greater risk of disease when exposed than when unexposed • RR < 1 is the lower risk of disease • RR is not symmetric over the role of D and E
Example: Relative Risk (RR) The risk of having pancreatic cancer is 2.4 time higher among coffee drinkers than non-coffee drinkers
Odds Ratio (OR) • OR is always non-negative • OR = 1 is the null value • OR > 1 indicates greater risk of disease when exposed than when unexposed • OR < 1 is the lower risk of disease • OR > RR • OR is symmetric over the role of D and E • Under rare disease assumption, OR closely approximates RR
Example: Odds Ratio (OR) Coffee drinkers are 2.6 time more likely to have cancer than non coffee drinkers Pancreatic cancer patients are 2.6 time more likely to be exposed in coffee drinking than non-diseased
Does associations indicate causal association? Not necessarily
Why causality assessment is so important in health research? • We are interested to identify the risk factors that influence the risk of disease • The objective of health research is to develop a sustainable intervention to reduce the risk of disease • Interventions are designed to reduce the exposure to the risk factors to control the infection
Causal Association • Association of disease occurrence with the risk factor is said to be causal if • The level of exposure is determined before the occurrence of the disease (level of exposure and Chronology) • The other conditions for both exposed and unexposed will remain identical • The factors which might be the outcome of exposure were not controlled by the identical condition We might require additional criterion to follow to be an association as causal, We are highlighting these three because these are linked with study designs.
Ideal experiment for causal association An ideal experiment Think about the causal effect of Coffee drinking (E) and Pancreatic Cancer (D)
Real world Experiment A real world experiment • Unobserved response is called counterfactual • Measures of causal effect depends on the distribution of counterfactuals Counterfactual of subject 1 Counterfactual of subject 2 Counterfactual of subject 3
Real world Experiment Let us consider a specific distribution of counterfactual Group 1 and 3 we observed the response to coffee drinking and 2 and 4 to non coffee drinking
Real world Experiment Population data on coffee drinking and pancreatic cancer with specific counterfactual distribution We might think of different distribution of counterfactual that might give us different values between 0 to inf. Such specific distribution does not guarantee RR = RRcausal
Real world Experiment Suppose for each group, the toss of a coin determines whether an individual of a group whether he/she is a coffee drinker or abstainer. We can expect the following 2 X 2 table Even if the distribution of exposure is random, Then on average, the real world experiment might determine the causal association
Study Designs We design our studies following the basic requirements so that our observed association could translate into causal association. • The basic study designs in epidemiological research are as follows • Observational • Cross Sectional • Case-Control study • Cohort Study • Experimental • Randomized control trial
Cross sectional survey • Select a random sample of size n from the study population • Example: Coffee drinking and pancreatic cancer
Cross sectional survey • Choice of an individual (under either exposure) is random • This fits with the required condition to be • In addition, Joint, marginal and conditional probabilities can be estimated using data from the cross sectional survey which really useful to translate the disease process.
Cross sectional survey • Not suitable for infectious or high fatal disease • Exposure and outcome examined simultaneously • Cannot infer the temporal sequence of E-D
Case-Control Studies • Identify the two sub-group of population of diseased and not diseased • Select a random samples from diseased and not diseased group separately • Measure subsequently the presence and absence of E of each individuals in the past in both samples
Case-Control Studies • The distribution of exposure condition is random • Confirms that exposure happened before disease • We can only estimate the conditional probabilities of exposure for given either disease condition • We can only estimate the Odds Ratio using the symmetric properties of OR • In rare disease condition, OR closely approximates RR
Case-Control Studies Example: Possible data from a Case-Control study (nd= nd’ = 100) The probability of getting coffee drinker is 2.6 time more likely in diseased group than not diseased group
Limitations of Case-Control Studies • Exposure measurement error • Selection bias through inappropriate choice of controls • Clear definition of case and control and predefined method of control selection could reduce the chance of bias but we have very few tools to control the exposure measurement error
Variants of Case-Control Studies • Risk set sampling • In a dynamic cohort, all disease does not happened at the same time. If a patient was identified at time t, we select controls from the population of individuals who are at risk at time t. • Case cohort design • In this approach we select a set of diseased individuals within a time interval [0, T] through risk set sampling. • m controls are chosen at random from the entire population at risk
Cohort Studies Sampling is carried out separately for sub populations at different levels of exposure • Identify two sub-groups of the population on the basis of their exposure level and follow-up • Take a random sample from each of the two subgroups • Measure subsequently the presence or absence of disease of the selected individuals of the both subgroups
Example data from Cohort Studies • Possible data from a cohort study (n=200) • Joint and marginal probabilities are not estimable • Only conditional probabilities conditioning on exposure are estimable • RR, OR and ER are estimable from such study design
Randomized Control Trial (RCT) outcome RANDOMIZATION Exposure no outcome Study population outcome Non-exposure no outcome baseline future time
Randomized Control Trial (RCT) A Randomized Control Trial • Provides high degree of validity to establish causality • Maintain all the advantage of cohort design • Ethical challenges of experimental research • Most costly & time consuming – Randomization, blinding… • Not feasible for outcomes that are rare or have long lag times
Hierarchy of Epidemiologic Study Designs Generates hypotheses Establish causality Case reports Case series Ecologic studies Cross-sectional studies Case-control studies Cohort studies Randomized controlled trials Tower & Spector, 2007
Common Errors and biases in causal association All study design for causal association suffers the following Errors and biases • Measurement error of disease and exposures • Information bias • Selection Bias • Confounder
Take Home Messages • Statistical association are not necessarily causal association • Study designs provides situations so that the real world experiments close approximate the outcomes to ideal experiments • Different study designs provide different levels of confident for causal association