Data Mining Service | Outsource Data Mining Services
Loginworks Softwares data mining services help you make better business decisions, understand your consumer behavior & achieve better sales. There is a cost effective, full service Data Mining Company. Learn more about all of our Data Mining and Data Collection Solutions. It the best data mining services can give your business a competitive edge. Check out this guide to learn how to successfully outsource.<br><br>https://www.loginworks.com/data-mining/

Data Mining Service | Outsource Data Mining Services
E N D
Presentation Transcript
10 Major Differences Between Data Analytics,Data Analysis and Data Mining People are generating tons of data every second. Every post on social media, each heartbeat, every link clicked on the internet is data. The world generated more than 1ZB of data in 2010. The massive data are often stored in data warehouses. These warehouses collect data from all possible sources. However, these data are often unstructured and meaningless, therefore, professionals need to make sense of them. Experts in this field use certain tools to make sense of these data in order to help businesses make an informed decision. Hence, those tools include data analytics, data analysis and data mining. The terms data analytics, data analysis and data mining are used interchangeably by people. However, there are small differences between the three terms. In simplest terms, data mining is a proper subset of data analytics and data analytics is a proper subset of data analysis and they are all proper subset of data science. It is easy to get confused, read on to get a better understanding of the three terms.
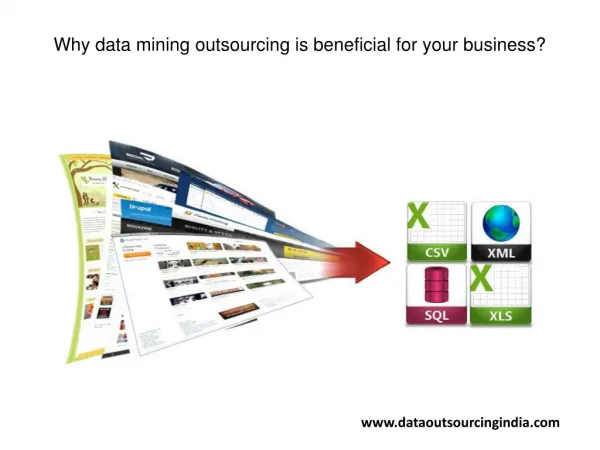
Data Mining We are starting with data mining because it is the smallest in the set we’re considering. Every tool, method or process used in data mining is also used in data analytics. Data analytics is data mining plus more. Wikipedia defines data mining as “the process of discovering patterns in large data sets involving methods at the intersection of machine learning, statistics, and database systems”. The Economic Times defines it as “process used to extract usable data from a larger set of any raw data”. These definitions give an overview of what data mining is about. Let’s delve deeper. Data mining was very popular in the 90s and early 2000s. Some sources say data mining is also known as the Knowledge Discovery in Databases (KDD) while others say it is one of the stages in KDD. However, what’s most important is data mining brings together data from a larger pool and tries to find a correlation between two concepts or items. For instance, it can find the correlation between almonds and fungi or beer and diapers.
The more common operations in data mining used to make meaning of data include clustering, predictive or descriptive model – forecasting, deviations, correlations between data sets, classification, regression and summarization. Clustering This is a common task in data mining and it is used in grouping data that are similar together. Information that has similar characteristics are grouped together. It brings a set of data together to find how similar they are and find facts that were previously unknown. Clustering explains the data and uses the data to predict possible future trends. Data mining uses clustering method in predicting the future. Deviations This is also known as anomaly detection or deviation detection. This aims to understand why certain patterns are different from the rest. It further studies data error and aims to find out why they are different and what caused Summarisation: This makes data more compact, therefore, making easier to understand, visualise and report. the difference. Classification This task aims to put data in groups. New data are classified into already existing structure or groups. For instance, carrying out a test to know the blood group of a person would place the person into any of the four blood groups. Furthermore, attempting to classify incoming emails as junk or genuine. Correlations This is understanding the links between two data sets. It is sometimes known as association rule learning. Its goal is to find patterns between
two unrelated data. For instance, finding the relationship between diapers’ and ‘beers’. Regression This aims to find the least error among a data set. Data Analytics Techopedia defined data analytics “as qualitative and quantitative techniques and processes used to enhance productivity and business gain“. Analytics is the logic and tools behind the analysis. Analytics is the engine that drives analysis. Businesses make decisions on the outcome of analytics. Margaret Rouse in her article, data analytics, included the use of “specialised systems and software” in the definition of data analytics. There are numerous tools used by data analysts, some software are Tableau Public, OpenRefine, KNIME, RapidMiner, Google Fusion Tables, NodeXL and many more. Data Analytics is the superset of data mining and a proper subset of data analysis. Data analytics involves using tools to analyze data in
making a business decision. For instance, your business offers massage services to people using electric massage chairs to help relieve stress and backache. If you’re interested in knowing who patronizes you, then you can create a table of your customers. You can further group your data by occupation, age, home address, etc using the data analytics tool. Quantitative techniques use mathematical and statistical tools and theories to manipulate numbers to obtain a result or pattern. On the other hand, qualitative analytics is interpretive, it is the use of non- numerical data such as images, audio, video, point of view, interviews or texts. More advanced data analytics tool include data mining, machine learning, text mining and big data analytics. Data analytics can also refer to software ranging from business intelligence (BI), online analytical processing (OLAP). Data analytics starts with defining the business objective, collecting data, checking for data quality, building an analytical model and then a decision based on the outcome. 1. Business objective: Data analytics starts with understanding the final goal. The team needs to know what is required of them. This is part the team plans, select the possible dataset and establish project plans in line with company goals. 2. Collecting data: The team selects the data that is required to carry out the analysis they want. Since data comes from different sources. The team has to check and collect data that are most relevant to the information they are trying to find out. 3. Data quality: This is where the team ensures the raw information is as clean as possible. Dirty data can influence results negatively and may cause the management to make wrong decisions. This is a very crucial step in data analytics. The data team must verify the data quality to ensure it is what is required.
4. Building analytical models: Once the team ensures the data is clean, the team gathers the data for analysis and they build analytical models. This is done with analytics software and programming languages such as Python, SQL, R and Scala. In most cases, a test run is done on the data to check if the outcome is close to or in line with the predicted outcome. If this turns out okay, the team then runs full analysis. 5. Outcome and decision: The next stage is the outcome, the result is evaluated. The team checks for accuracy of the results and degree of error generated. The result is then deployed, a report is written and the team performs a final check on the project as a whole. This is termed project review. Once, this is done, observations and results are passed to the management to make an informed decision. Data Analysis EDUCBA defines data analysis as “extracting, cleaning, transforming, modeling and visualization of data with an intention to uncover meaningful and useful information that can help in deriving conclusion and take decisions“. This definition is comprehensive and
it covers every aspect of data analysis. However, John Turkey, a world-renowned statistician, added that data analysis includes making the results more precise or accurate over time. Data analysis often used interchangeably with data analytics, however, there are slight differences between them. In the definition of analytics, we saw that it involved the use of specialized software and tools. Data analysis is a broader term and it fully engulfs data analytics, in other words, data analytics is a subcomponent of data analysis. Data analysis involves both technical and non-technical tools. There are several stages in data analysis and the phases can be iterative to improve accuracy and get better results. Data analysis is very wide and teams work on different aspects. However, we state the most common steps used by data analysis teams. This is putting a team together, understanding business objective, data collection, data cleaning, data manipulation, communication, optimise and repeat. 1. Put a team together: In testing any hypothesis, the first step is to put a team together that would carry out the analysis. 2. Business objective: The problem bugging the business is put across to the team. This serves as the background of the analysis the team hopes to get a hypothesis on. 3. Data collection: Once the team understands the business objective, it set out to collect data needed. 4. Data cleaning: This is a very important and crucial step. This is identifying inaccurate or incomplete data and deleting or modifying them. Dirty data can lead to wrong conclusions which can be fatal for a business. The team has to ensure the data is as clean as possible. This is the stage the data is inspected.
5. Data manipulation: In this stage, the data is subjected to mathematical and statistical methods, algorithms modelling of data. The data is transformed from one structure to another. 6. Optimise, communicate and repeat: Before communicating results and reports to the management, the team has to optimise the data by checking and accounting for error due to calculation or mathematical method. Once, the results are ready, the team presents their findings to the management in form of images, graphs or video. If results require the new perspective, then the team would repeat the process from the beginning. Connect With Source Url:- https://www.loginworks.com/blogs/top-10-small-differences-between- data-analyticsdata-analysis-and-data-mining/