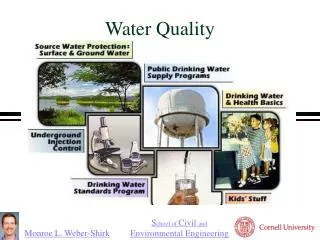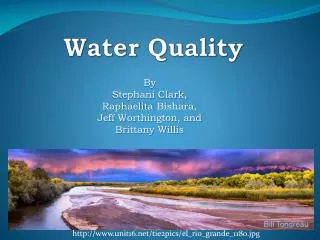
Water quality
Water quality. http:// www.youtube.com/watch?v = USUCHHdmlIc. Water quality. I. Background information According to the United nations development report- 1/6 of the worlds population lacks access to clean water 40 % of the human population does not have adequate access to human sanitation

Water quality
E N D
Presentation Transcript
Water quality http://www.youtube.com/watch?v=USUCHHdmlIc
Water quality • I. Background information • According to the United nations development report- 1/6 of the worlds population lacks access to clean water • 40 % of the human population does not have adequate access to human sanitation • In Africa people are forced to share their fresh water supply with animals. These water sources become breeding grounds for pathogens
Water quality • II. Water pollution sources • A. Point sources- • 1. pipes from cities and industry that dump untreated wastes into waterways • 2. Sewage treatment plants that don’t remove all of the pollutants • 3. feedlots and oil spills
Water quality • Nonpoint sources- spread pollution over a wide area • 1. runoff- that carries sediment from erosion from logging, fire, construction or farming • 2. runoff of chemical fertilizers or pesticides from agriculture or lawns • 3. drainage of acids, minerals, sediments and metals from abandoned mines • 4. more difficult to control than point sources
Water quality • III. Water pollutant: any substance picked up by the water that make it impure • A. Drinking water contains minerals and other substances. To say that it is pure simply means that it is usable for normal purposes • B. Water Pollutants • 1. disease causing agents- bacteria, parasites, viruses • 2. inorganic chemicals salts, acids, and toxic metals
Water quality • 3. synthetic organic compounds- detergents, oil, industrial wastes, pesticides, and solvents • 4. fertilizers- plant nutrients from agriculture run off • 5. sediments: soil , silt, and clay from land erosion • 6. radioactive materials • 7. thermal pollution: heat from industrial and electric power plants
Water quality • Iv. Bmp’s Best management practices • A. It is extremely costly and can take a long time to fix a watershed pollution problem • B. It is easier to use BMP’s to prevent this from happening • 1. Forestry- leave a 50-100 ft buffer along the stream to filter off contaminants and run off • 2. Homes- Use fertilizer and pesticides on lawns sparingly. Leave shrubs and trees with extensive root cover and leave abundant plant cover to help hold soil in place
Water quality • 3. Construction sites- Place erosion control fabric on stream bans to prevent sediment from reaching the streams • 4. urban areas- Provide settling basins to prevent direct runoff from parking lots to enter streams. Allow water to filter through the ground to help remove harmful contaminants • 5. farming leave crop stubble to help keep the soil in place over the winter. Leave trees and shrubs with extensive root systems along streams to hold soil during floods and filter pollutants • 6. Livestock grazing- build a concrete lined pit to store manure and spread it on fields . Leave trees and shrubs around stream
Water quality • 7. motorized recreation- do not drive atv through wetlands, lakeshores, rivers, or streams
Water quality • IV. Indicators of water pollution • 1. dissolved oxygen- the amount of oxygen dissolved in the water. Normal levels are 9 ppm. If it drops below 4ppm then fish cannot survive • 2. Biological oxygen demand- decomposing bacteria uses up the oxygen supply when they break down the organic wastes dumped in the water. The bacteria may reduce the dissolved oxygen so much that some aquatic organisms die
Water quality • C. Coliform bacteria- these are intestinal microorganisms that are found in the soil and in the feces of humans and other animals. • Although these are Harmless they are an indicator that harmful bacteria may also be present • V. Untreated sewage will cause the bacteria to start feasting immediately and will drop the Dissolve oxygen levels down stream to drop dramatically and can kill the fish
Water Quality • Areas where untreated sewage is added to the stream • Bacteria Feast • BOD increases enormously • Areas immediately downstream – DO levels drop drastically and fish die.
Water quality • Rivers can recover fairly quickly- once the waste is broken down the levels return to normal, oxygen is added by the water mixing, and photosynthesis • If additional sewage is added the river may not recover. These rivers have no fish and have high counts of bacteria. • When non biodegradable or toxic wastes are added bacteria have no effect on that pollution. • Lakes and ponds have less flow so they have less of a chance to purify themselves.
http://www.wgbh.org/articles/25-Years-Later-A-Poisoned-Town-Cant-Come-Clean-3057http://www.wgbh.org/articles/25-Years-Later-A-Poisoned-Town-Cant-Come-Clean-3057
Water quality • V. Eutrophication of lakes • A. Oligotrophic – the area that drained by the lake is nutrient poor • It supports little plant life and have low algae. The have high Do levels and support many fish • B. Eutrophic- the area that nutrients such as fertilizer are released into the lake and nutrient levels are high. • The lake supports a lot of plant life. They grow a large amount of algae which cut off sunlight to plants in the lake
Water quality • This causes low do levels and species such as carp and bullheads • As nutrients build up over time and sediment gets carried into the lake more recycling of nutrients can occur. This can cause an oligotrophic lake to become eutrophic- process is called eutrophication. • C. Pollution speeds up the natural process with fertilizers and other chemicals. This acceleration by humans is called cultural eutrophication.
Water quality • D. Plants build up across the top of the lake and when they die they fall to the bottom to be decomposed. Bacteria use up a lot of Do breaking them down. Fish begin to die and more decay occurs further reducing do levels • Fish in the upper layers survive but not in the lower layers.
Pollution of ground water • VI. Pollution of ground water • A. Ground water flows slowly so the flow does not purify the water • B. Soil particles are not efficient at filtering out the pollutants • C. Once in the groundwater pollutants are impossible to clean up. • D. Preventing contamination seems to be the best solution.
Water quality • VII. Waste water treatment • A. Primary treatment: first stage removes solid objects and materials that will settle out. • They use a large settling tank called the primary clarifier that allows sediment to fall and grease to rise to the top. • The grease is skimmed off and sediment is removed • B. Secondary treatment: removes dissolved or organic matter and kills microorganisms
Water quality • Water is pumped into aeration tanks were oxygen is present to help microorganisms decompose organic materials. • When all is digested the microorganisms die and fall to the bottom of the tank • Liquid is treated with chlorine to kill 99% of bacteria and viruses • Enters lakes and streams