Comparative Analysis of Extratropical Cyclones Using Recent Reanalyses Data
This study examines the properties and climatology of extratropical cyclones by utilizing four recent reanalyses for winter periods in both Northern and Southern Hemispheres. Using an objective feature tracking algorithm, the study tracks cyclone behavior and identifies spatial distribution and intensity differences. The findings indicate improved agreement among newer high-resolution reanalyses compared to older versions, providing confidence in their representation of these storms. While similarities exist, certain discrepancies in cyclone intensity are still evident, necessitating further direct observational comparisons.

Comparative Analysis of Extratropical Cyclones Using Recent Reanalyses Data
E N D
Presentation Transcript
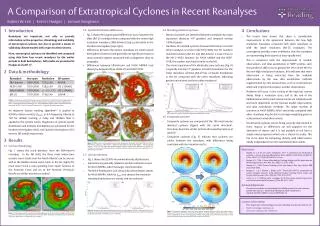
A Comparison of Extratropical Cyclones in Recent Reanalyses 1 Introduction Reanalyses are important, not only to provide information on the properties, climatology and variability of extratropical cyclones, but also to provide a means of validating climate models with respect to these storms. Here, extratropical cyclones are identified and compared using data from four recent reanalyses for the winter periods in both hemispheres. Full results are presented in Hodges et al (2011)1. 2 Data & methodology An objective feature tracking algorithm2,3is applied to 850hPa relative vorticity (ξ850), at 6-h frequency, filtered to T42 for reliable tracking. A 2-day and 1000km filter is applied to the cyclone tracks. Diagnostics of cyclone spatial distribution and intensity distributions are presented for the Northern Hemisphere (NH) and Southern Hemisphere (SH) winters, DJF and JJA respectively. 3 Results 3.1Cyclone climatology Fig. 1 shows the track densities from the ERA-Interim reanalysis. In the NH (left) the three main winter-time oceanic storm tracks over the North Atlantic can be seen as well as the Mediterranean storm track. In the SH (right) the main storm track is seen spiralling from South America to the Antarctic Coast and on to the Antarctic Peninsula. Results are similar to previous studies4. • 3.4 Matching identical cyclones • Identical cyclones are identified between reanalyses for mean separation distances <4° geodesic and temporal overlap >50% of points. • Numbers of matched cyclones between ERA-Interim and the other reanalyses is similar in the NH (>80%). The SH numbers matched between JRA-25 and ERA-Interim is lower than in the NH (~65%); however, for NASA MERRA and the NCEP-CFSR, the number matched is similar to the NH. • The mean separation of the identically same cyclones (Fig. 4) is typically less than 2° geodesic in both hemispheres for the latest reanalyses, whereas JRA-25 has a broader distribution in the SH compared with the other reanalyses, indicating greater uncertainty similar to older reanalyses4. • 3.5 Composite cyclones • Composite cyclones are computed of the 100 most intense identical cyclones aligned with the storm direction5. Structures found are similar to those discussed by Catto et al (2010)5. • Composite cyclones (Fig. 5) indicate that cyclones are similar between the reanalyses, with differences being consistent with the intensity results. • 4 Conclusions • The results have shown that there is considerable improvement in the agreement between the new high resolution reanalyses compared with older reanalyses or with the lower resolution JRA-25 reanalyses. The convergence provides some confidence that the reanalyses are representing these storms at least equally well. • This is consistent with the improvement in models, observations, and data assimilation in NWP systems, such that predictive skill is now as good in the SH as in the NH. For the new high resolution reanalyses, this indicates that more information is being extracted from the available observations by the new data assimilation methods supplemented by new observations, such as scatterometerwinds and improved microwave sounder observations. • Problems still occur in the vicinity of the high but narrow Andes, likely a resolution issue, and at the end of the Mediterranean storm track where storms are relatively weak and more dependent on the forecast model, observations, and data assimilation methods. The larger number of extremes in NASA MERRA, MSLP and winds, compared with other reanalyses may be due to stronger weighting given to scatterometer wind observations. • Extratropical cyclones are not being correctly represented in every respect, as differences are still apparent for the intensities of storms and it is not possible to tell from a simple intercomparison which one is closest to reality. This has to be done by comparing directly with observations, ideally independent from the assimilated observations. 3.2 Spatial distribution differences • Fig. 2 shows the largest spatial differences occur between the older JRA-25 reanalysis when compared with the newer high resolution reanalyses (ERA-Interim) (top), particularly in the Southern Hemisphere (top right). • Differences between the newest reanalyses are small in both hemispheres (bottom) and generally not significant except in some common regions associated with cyclogenesis close to orography. • Differences between ERA-Interim and NASA MERRA (not shown) lay between those of JRA-25 and NCEP-CFSR. 3.3 Cyclone intensity • Fig. 3 shows the 925hPa max wind intensity distributions. • Intensities are generally related to spatial resolution except for NASA MERRA, which has larger wind intensities. • The MSLP distributions (not shown) also show deeper storms for NASA MERRA, while for ξ850 (not shown) the maximum intensity distributions are closely tied to resolution. Table 1. Reanalyses used. Note the following acronyms: ERA-Interim—ECMWF Interim Re-Analysis; JRA-25—Japanese 25-year ReAnalysis; MERRA—Modern Era Retrospective-analysis for Research and Applications; CFSR—Climate Forecast System Reanalysis; DA—Data Assimilation system; 3DVAR—Three-Dimensional Variational; 4DVAR—Four-Dimensional Variational; GSI—Gridpoint Statistical Interpolation. Figure 4. Probability density distributions for mean separation distance for ξ850tracks that match for (a) the NH and (b) the SH. Units are geodesic degrees, and bin widths are 0.25°. Figure 2. Difference in ξ850extratropical cyclone track densities for the period 1989–2009: (left) NH, DJF (a) ERA-Interim – JRA-25, (c) ERA-Interim – NCEP-CFSR and (right) SH, JJA (b) ERA-Interim – JRA-25, (d) ERA-Interim – NCEP-CFSR. The white lines delineate regions where p values for the differences are below 0.05. Densities are in units of number density per month per unit area, where the unit area is equivalent to a 5° spherical cap (~106 km2). • References • Hodges, K. I., R. W. Lee, and L. Bengtsson, 2011: A comparison of extratropical cyclones in recent reanalysis ERA-Interim, NASA MERRA, NCEP CFSR, and JRA-25. J. Clim., DOI: 10.1175/2011JCLI4097.1 In Press. • Hodges, K. I., 1994: A General-Method for Tracking Analysis and Its Application to Meteorological Data. Mon. Wea. Rev., 122 (11), 2573–2586. • Hodges, K. I., 1995: Feature Tracking on the Unit-Sphere. Mon. Wea. Review, 123 (12), 3458–3465. • Hodges, K. I., B. J. Hoskins, J. Boyle, and C. Thorncroft, 2003: A comparison of recent reanalysis datasets using objective feature tracking: Storm tracks and tropical easterly waves. Mon. Wea. Rev., 131, 2012–2037. • Catto, J. L., L. C. Shaffrey, and K. I. Hodges, 2010: Can climate models capture the structure of extratropical cyclones? J. Clim, 23, 1621–1635. • Acknowledgements • The authors would like to acknowledge the following centres for their datasets: • ECMWF: ERA-Interim | NOAA NCEP, NOMADS & NCDC: NCEP-CFSR | • GMAO & GES DISC: MERRA | JMA & CRIEPI: JRA-25. • Contact information • ESSC, Department of Meteorology, University of Reading, 3 Earley Gate, RG6 6AL, UK • Email: r.w.lee@pgr.reading.ac.uk • www.met.reading.ac.uk/~tz000214/ Figure 3. Maximum wind intensity distributions based on full-resolution 925-hPa winds referenced to ξ850tracks for the winter periods: (a) in the NH for DJF; and (b) in the SH for JJA. Values are number per month for the period 1989–2009. Bin widths are 5 m s-1for winds. Figure 5. Horizontal composites of the 100 most intense identical cyclones of MSLP and system relative winds at 925 hPa for the NH: (a) ERA-Interim, (b) JRA-25, (c) NASA MERRA, and (d) NCEP-CFSR. Colour contours with interval 2.5 m s-1show the system relative wind speeds, vectors show the system relative wind vectors, and black contours show the MSLP with contour interval 5 hPa. Figure 1. Extratropical cyclone track density climatology based on the ERA-Interim reanalysis (1989–2009), ξ850, (a) NH, DJF; and (b) SH, JJA. Densities are in units of number density per month per unit area, where the unit area is equivalent to a 5° spherical cap (~106km2).