
Genetic Drift
E N D
Presentation Transcript
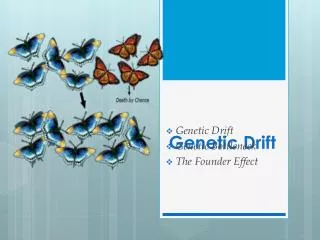
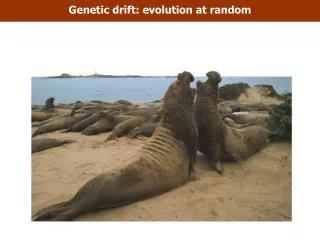
Genetic Drift • In small, reproductively isolated populations, special circumstances exist that can produce rapid changes in gene frequencies totally independent of mutation, recombination, and natural selection. These changes are due solely to chance factors. The smaller the population, the more susceptible it is to such random changes. This phenomenon is known as genetic drift.
Neutral alleles • Controversial when first proposed (Kimura 1968) • Incontrovertible in 2001: • DNA sequence polymorphisms are abundant • In Eukarya, most of the genome is noncoding • most sequence polymorphism lies in noncoding regions • Most sequence polymorphisms appear selectively neutral • Not useful for studies of genetic adaptation • Ideal for detection of population substructure and phylogenetic relationships
Genetic Drift • For example, when women and their mates are both heterozygous (Aa) for a trait, we would expect that 1/4 of their children will be homozygous recessive (aa). By chance, however, a particular couple might not have any children with this genotype (as shown below in the Punnett square on the right). • Unless other families have an unpredictably large number of homozygous (aa) children for this trait, the population's gene pool frequencies will change in the direction of having fewer recessive alleles.
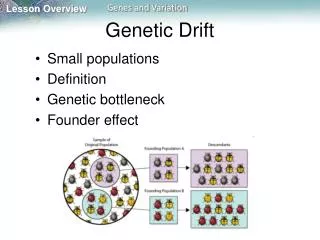
Genetic Drift The net effect of genetic drift on a small population's gene pool can be rapid evolution, as illustrated in the hypothetical inheritance patterns shown below. Note that the red trait dramatically increases from generation to generation. It is important to remember that this can occur independent of natural selection or any other evolutionary mechanism.
2N alleles gen 0 gen 1 Inbreeding in finite populations • Assume a population size of N, therefore 2N alleles in population. Imagine eggs and sperm released randomly into environment (e.g. sea) • What is the probability of 2 gametes drawn randomly having the same allele? probability = 1/(2N)
Inbreeding in finite populations • Therefore, after 1 generation the level of inbreeding is F1 = 1/2N • After t generations the probability is
Why? gen t-1 gen t Probability ofpicking 2nd allele 1/(2N) 1 - 1/(2N)
More generally GeneticDrift Hartl and Clark p.286 Ft = Probability that any 2 alleles drawn randomly from thepopulation are identical by descent
Genetic drift and heterozygosity • Genetic drift will to a gradual loss of genetic diversity • Follow an individual locus and gene frequency will drift until one allele becomes fixed
2N ? Genetic drift Mathematical Model Genetic diversity: HT = (1 – 1/2N) * HT-1 Probability of identity: FT = 1/2N + (1 - 1/2N) * FT-1 Average time to fixation: 4N
Several populations • Genetic drift will make initially identical population different • Eventually, each population will be fixed for a different allele • If there are very many populations, the proportion of populations fixed for each allele will correspond to the initial frequency of the allele • Small populations will get different more rapidly
Importance of genetic drift • Two causes for allele substitutions: • Selection -> adaptive evolution • Genetic drift ->non-adaptive evolution • Most populations are geographically structured • All populations are finite in size • All genetic variation is subject to genetic drift but not necessarely to selection • Genetic drift as a null hypothesis against which evidence for selection has to be tested
4NfNm Ne = (Nf + Nm) 1 1 1 Σ = n Ni Ne (Harmonic mean) Effective population size • Effective population size < Census size (in most cases) • The effective population size is the size of an ”ideal” population having the genetic properties of the studied population • The effective population size is determined by • Large variation in the number of offspring • Overlapping generation • Fluctuations in population size • Unequal numbers of males and females contributing to reproduction
Effective population size • What is an ideal population like? • (Remember - each parent a has an equal and independent chance of being the parent of each descendent allele.) • This is approximated by a Poisson distribution of reproductive success. • (Reproductive success = # of offspring per parent, or per parental allele.)
Effective population size • For diploids: • where V is the variance in reproductive success among diploid individuals. (Note that the variance among individuals in reproductive success with a Poisson distribution is 2 in a steady-state population, so that Ne = N-1/2.)Note also that Ne can also be as great as 2N-1, if there is no variance in reproductive success. This fact is often used in animal and plant breeding to slow the loss of genetic material.
4NfNm Ne = (Nf + Nm) Effective population size • Population size in natural populations does not remain constant • Ne with population size fluctuations is approximately the harmonic mean of N over time: • The harmonic mean is very sensitive to small values. • (Ne << ) if N is variable
Backwards: the coalescent approach • Simplification: 0, 1 or 2 offspring • Coalesce: have the same parent • Probability to coalesce: 1/N • Probability Not to coalesce: 1 – 1/N • t generations: (1-1/N)t • Average time to coalesce for 2 genes: N • For the whole population: 2N
Founder effects • Another important small population effect is the founder effect or founder principle. This occurs when a small amount of people have many descendants surviving after a number of generations. The result for a population is often high frequencies of specific genetic traits inherited from the few common ancestors who first had them.
A new population emerges from a relatively small group of people.
Founder effect example • In the Lake Maracaibo region of northwest Venezuela, for instance, there is an extremely high frequency of a severe genetically inherited degenerative nerve disorder known as Huntington's disease. Approximately 150 people in the area during the 1990's had this fatal condition and more than 1,000 others were at high risk for developing it. • All of the Lake Maracaibo region Huntington's victims trace their ancestry to one woman who moved into the area a little over a century ago. She had an unusually large number of descendents and was therefore the "founder" of this population with its unpleasant genetically inherited trait.
Founder effect example It is also possible to find the results of the founder effect even though the original ancestors are unknown. For example, South and Central American Indians were nearly 100% type O for the ABO blood system. Since nothing in nature seems to strongly select for or against this trait, it is likely that most of these people are descended of a small band of closely related "founders" who also shared this blood type. They migrated into the region from the north, mostly by the end of the last Ice Age.
Bottleneck In some species, there have been periods of dramatic ecological crisis caused by changes in natural selection, during which most individuals died without passing on their genes. The few survivors of these evolutionary "bottlenecks" then were reproductively very successful, resulting in large populations in subsequent generations. The consequence of this bottleneck effect is the dramatic reduction in genetic diversity of a species since most variability is lost at the time of the bottleneck.
Migration • A cline is a gradual change in allele frequency along a geographic gradient • Ecotypes are genetically distinct forms that are consistently found in certain habitats. • Changes in allele frequency can be mapped across geographical or linguistic regions. • Allele frequency differences between current populations can be correlated to certain historical events. • Contrary to selection and genetic drift gene flow homogenizes allele frequencies • Genetic diversity is restored if immigrants carry new alleles or alleles which are rare in the population
Patterns of geographic variation • Sympatric, parapatric and allopatric variants • Subspecies are recognizable geographic variants within a species (usually subject to discussions) • A hybrid zone is a region where genetically different parapatric species or population interbreed. • Character displacement: sympatric populations of two species differ more than allopatric populations
Allele distributions can reflect historical events • Creutzfeldt-Jakob disease (CJD) is caused by a mutation in the prion protein • 70% of families with CJD share the same allele • Families from Libya, Tunisia, Italy,Chile and Spain share a common haplotype. • These populations were expelled from Spain in the Middle Ages.
Genetic drift and mutation no mutation gen t-1 gen t 1/2N 1 - 1/2N Probability ofneither of 2 allelesbeingmutated is (1-m)2
gen t-1 gen t 1/2N 1 - 1/2N Equilibrium Between Mutation and Drift • Run the recurrence equation over and over and eventually it will settle down to an equilibrium Probability ofpicking 2nd alleleand it not beingmutated
Migration and drift • Migrants will also act to counter genetic drift within a population • Introduce new alleles into population Immigration rate(probability of allele drawn at random being from a migrant)m N indvs.
2N m ? Probability of identity: FT = [1/2N + (1 - 1/2N) * FT-1]* (1 – m)2 (assumes that the immigrants are different from each other) N = 100 N = 100 m = 0 m = 0.01 Gene flow
2N μ ? Probability of identity: FT = [1/2N + (1 - 1/2N) * FT-1]* (1 – μ)2 (Mutation has the same effect) Assumes that each mutation creates a new allele: Infinite allele model Mutation also retards the loss of genetic variability due to genetic drift
1 1 F F 4N m + 1 4N μ + 1 Equilibrium • After a long time (the longer the larger the population) there will be an equilibrium between genetic drift, gene flow and mutation • F and H will not change any more (if everything remains constant !!) FT = [1/2N + (1 - 1/2N) * FT-1]* (1 – m- μ)2 Mutation – drift equilibrium Migration – drift equilibrium
Migration Models – Island Model - One Way Migration m is the probability that a randomly chosen allele is a migrant • Change of allele frequency with one way migration • A is fixed on the island • a arrives from the mainland at rate m =0.01
Mutation and Migration m = 10-4 m = 10-2 Estimation of m 10 generations Present allele frequency in “island” = pt = 0.484 Allele frequency in mainland p* = 0.507 Initial allele frequency in island = p0 = 0.474 m = proportion of migrant alleles each generation
Estimation of M 10 generations Present allele frequency in “island” = pt = 0.484 Allele frequency in mainland p* = 0.507 Initial allele frequency in island = p0 = 0.474 m = proportion of migrant alleles each generation
p = 0.2 p = 0.8 m = 0.10 Island Model of Migration Many large subpopulations Average allele frequency = frequency in migrants The change frequency in the subpopulations:
Change in allele frequency over time • Five subpopulations • 1, 0.75, 0.5, 0.25, 0
Change in Allele Frequency Over TimeThe Effect on the Fixation Index • total number of alleles = 2N • m = proportion of alleles replaced by alleles from migrants • 2Nm = number of migrant alleles in any generation • Assumptions: • N is large • m is small
Effect of Migration on Genetic Divergence Extreme case Nm =0 F hat =1 • Nm = 0.25 one migrant every fourth generation: F hat = 0.50 • Nm = 0.5 one migrant every second generation: F hat = 0.33 • Nm = 1 one migrant every generation: F hat = 0.20 • Nm = 2 two migrants every generation: F hat = 0.11 • The equilibrium frequency for the fixation index decreases as the number of migrants increases
Quantitative Genetic Variation • The loci involved in quantitative traits are often unknown, and their slight effect on the phenotype does not allow to count alleles in order to determine variation • Quantitative genetic variation is measured statistically: one estimates the variance of the trait in a population • VP = VG + VE (+VGxE + cov(G,E)) • The variance has the advantage to be addititve: the variance attributable to several factors can be added to obtain the total variance.
Heritability • Proportion of genetic variance in the phenotypic variance h2 = VG /(VG + VE ) • Heritability can be measured from correlations between parents and offspring or studies of relatives • Very different degree of heritability in different traits • Artificial selection can be carried out to see if there is a genetic basis for the observed variation • Heritability can also be estimated from the rapidity of change in a trait under artificial selection
Genetic distance • Genetic variation among populations can be measured as genetic distance • Example: Nei’s genetic distance D • Probability of identity of two genes: J=pi2 J1, J2, J12 • Index of genetic identity: • Genetic distance: D = -ln(I) • There are many other estimators for genetic diversity, some defined particularly for certain types of genetic markers
Collared lemmings on small islands (1) Microsatellite data (4 loci): Average He = 0.83 Kent region FST = 0.047 (Ehrich et al. 2001)
at equilibrium 4Nμ E(H) 4Nμ + 1 Observed H = 0.83 4Nμ 4.9 The island populations are probably not isolated. Population size (or μ) would have to be much larger than observed in order to maintain the observed level of genetic diversity. Collared lemmings on small islands (2) • In isolated small populations, variation is lost by genetic drift Average μ for microsatellites: 5*10-4 N = 2450 (10 x) 5*10-3 N = 245
FST = 0.047 Nm 4.4 immigrants (at equilibrium) In order to maintain high genetic diversity in small island populations, some migrants have to cross the ice every year. Alternatively the islands have to be recolonized relatively often after local extinctions Collared lemmings on small islands (3) FT = [1/2N + (1 - 1/2N) * FT-1]* (1 – m)2 Isolated small populations diverge under the effet of genetic drift
Several demes: differentiation • A large population is divided into local demes • Genetic drift will occur in each deme and make allele frequencies diverge • The probability of IBD in each deme will increase • After t generations on average F = 1 – (1 – 1/2N)t • When in all demes all individuals are descendent from one ancestor F = 1 • FST is used as measure for population differentiation Two etimates:
Zygosity in the infinite alleles model • Any number of distributions of allele frequency can result in the same homozygosity • Effective number of alleles • The number of equally frequent alleles that would be required to produce the same homozygosity as that actually observed Population 1: p = 0.7, q = 0.1, r = 0.1, s = 0.1 ke = 1.92 Population 2: p = 0.5, q = 0.3, r = 0.2 ke = 2.63 Population 3: p = 0.6, q = 0.4 ke = 1.92 Population 4: p = 0.5, q = 0.5 ke = 2.00
Selective neutrality and the infinite alleles model Amino acid polymorphisms Are amino acid polymorphisms are selectively neutral? • 1. Examine allozyme polymorphisms • Plug in observed homozygosities • Estimate Nm • approximately 10-6 N = 1040000 • Reasonable? 2. Compare observed distribution of heterozygosity with an observed distribution • Observed heterozygosity of 74 genes (shaded bars) • Expected heterozygosity (open bars) • Are these different?
Summary • Genetic drift: In a finite population allele frequencies fluctuate at random and eventually one allele will be fixed • After 4N generations all individuals descend from one ancestor • Genetic diversity is lost more rapidly in small populations • Inbreeding reduces the number of heterozygotes • Inbred individuals can have lower fitness: inbreeding depression • The genetic composition of isolated populations diverges under the effect of genetic drift • Gene flow homogenizes allele frequencies among populations • After a long time, the genetic variability in a population reaches an equilibrium level: mutation – immigration – drift equilibrium