GPS
GPS. Fall 2000 Spring 2001. What is GPS ?. Constellation of satellites Developed by Department of Defense Used 24 hrs./day anywhere on Earth. Where on Earth are We?. Dead reckoning- ` direction calculated by last position. Land-based positioning - Uses radio towers, Must have three towers

GPS
E N D
Presentation Transcript
GPS Fall 2000 Spring 2001
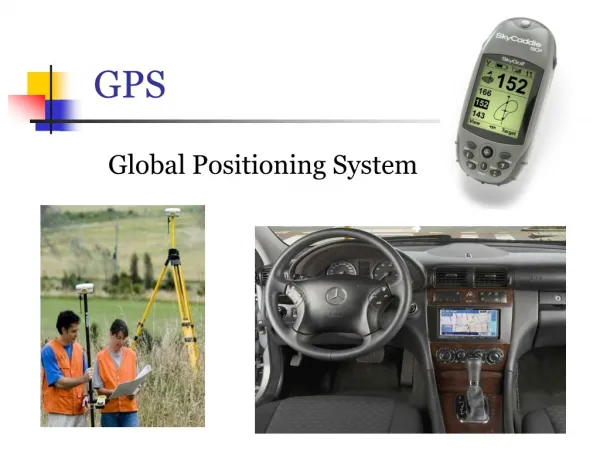
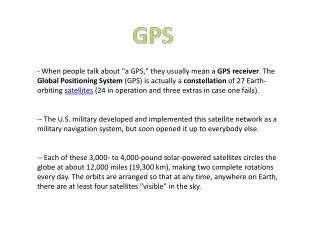
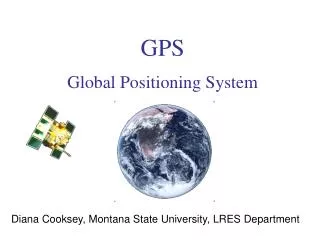
What is GPS? • Constellation of satellites • Developed by Department of Defense • Used 24 hrs./day anywhere on Earth
Where on Earth are We? • Dead reckoning- `directioncalculated by last position. • Land-based positioning -Uses radio towers, Must have three towers • Satellite-based positioning-AKA. Global positioning system. GPS for short.
Segments of GPS • Space- Satellites • User- Us • Control- Monitoringstations
Space • 24 satellites • 12,000 miles above Earth • Orbit twice daily • Always have at least 4 satellites “In View”
“In View” • = above horizon • Each satellite sends & receives radio signals • Radio signals travel 186,000 miles per second • Satellites equipped with atomic clock for accuracy
Uses • Military • Industrial • Commercial • Civilian
A scientists working on a GPS satellite • Satellite Information • Name --> NAVSTAR • Man.-> Rockwell international • Alt. --> 10,900 Nautical miles • Lbs.. --> #1900 in orbit • Size. --> 17' with solar panels extended • Orbital R. 12 hr • Orbital P. 55° to equatorial plane • Planed life 7.5 years • # built 11 Block 1 prototype • 28 Block 2 prototype • Constellation 24 satellites
triangulation Data reception/ distribution
Cars, planes, and boats use GPS to Navigate. Triangulation is uses by receivers in the vehicles to pin point position. Multiple users
The Pseudo-random code. GPS systems use a complicated digital code to record information and send their signal for our receivers. The advantage is with these codes you can also make time measurements. Satellites not only transmit a pseudo-random code for timing but also transmit a “Data Message” about there exact orbital location and their systems health
Quick plan= a scale that gives you PDOP and Nsats in order to calculate good data collecting days and times PDOP=positional dilution of precision Nsats= satellites numbers available
Satelev/ Satellite Level= how high there are in the sky. During the day
GPS Mapping of the Beaver Creek Field Research Station Nick P. & Denver J. Fall 2000 Spring 2001
Nick P. Computer man
Denver J. Mapping Man
Our plan: To create an GPS accurate map of the field station
Beaver Creek Field Research Station 400 + acres of mapping pleasure
Some Starting Questions • What do we need to know about mapping? • What should we Map? • When finished how will people use our map? • What type of data do we need gathered?
Some Starting Questions • What kind of equipment do we need? • How long will it take? Will we be finished by the end of the year? • What efforts shall we undertake to prepare future students interested in GPS mapping?
How we use GPS 1. Look at Quick Plan program to find when the data collection will be good. 2. Decide what we want to map. 3. Make a data dictionary for sorting our data. 4. Begin mapping area in interest.
5. When we’re done we return to school and load the data in to the computer. 6. After reviewing the data, we decide whether to remap or correct. 7. Retrieve internet correction files from http://www.ngs.noaa.gov/cgi-test/ufcors2.prl, to differentially correct data. 8.Export to ArcView.
Problems we had The battery going dead when mapping,Poordata reception, Weather, School Conflicts, illnesses Not being able to correct our data files. Transportation problems during the winter. Technology problems with computers Among many others
Pathfinder Office We use Pathfinder to analyze correct, export, and delete data. We also set up data dictionaries which it an organizer for data, form here we can load and unload data from the GPS receiver. ArcView In ArcView we are able to set projections placing items were they need to be, also can create good looking maps of what we are doing. Here we can set specific values for different features giving them distinction from other data layers.
Some of our field work • Trails/roads • Fields • Steam/ponds • Corner points • Bird feeders At the Beavercreek field research station.
Our First Generation Map of the Beaver Creek Field Research Station
Mapping Deer Trails with GPS by Andy Eklof and Randy Klatt
What Vegetation Types Do Deer Prefer?
Our Hypothesis: Deer Prefer Areas Dominated By Oak, Aspen, and Pine Vegetation.
Where Did We Get The Background For Our Hypothesis? “Deer trail abundance suggested a strong preference for open, aspen, and jack pine habitats. Lower deer use occurred in oak and red pine habitats…….If the management objective is to maintain the existing deer habitat suitability in central Wisconsin, we recommend maintaining as much of the existing open, aspen, and jack pine habitats as possible.” -Habitat Relationships of Deer and Ruffed Grouse in Central Wisconsin John F. Kubisiak and Robert E. Rolley Wisconsin Department of Natural Resources Research Report #176, March 1998
Where And When Did We Perform Our Research?
How Did We Record The Deer Trails?
What Did We Do With Our Recorded Data?
How Did We Know What Vegetation Dominated The Area Where We Did Our Research?
What Type of Vegetation Did Deer Prefer?
What Type of Vegetation Did The Deer Prefer The Most?
“Deer trail abundance suggested a strong preference for open, aspen, and jack pine habitats. Lower deer use occurred in oak and red pine habitats…….” While we found that deer prefer vegetation dominated by oak and pine, they also prefer open fields surrounded by oak and pine vegetation. To Summarize Our Findings Original Hypothesis