Oligopoly
Oligopoly. Characteristics Small number of firms Product differentiation may or may not exist Barriers to entry. Oligopoly. Examples Automobiles Steel Aluminum Petrochemicals Electrical equipment Computers. Oligopoly. The barriers to entry are: Natural Scale economies Patents

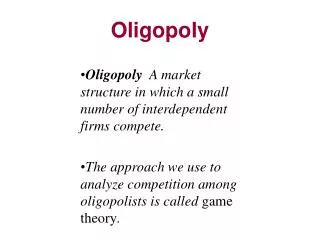
Oligopoly
E N D
Presentation Transcript
Oligopoly • Characteristics • Small number of firms • Product differentiation may or may not exist • Barriers to entry Chapter 12
Oligopoly • Examples • Automobiles • Steel • Aluminum • Petrochemicals • Electrical equipment • Computers Chapter 12
Oligopoly • The barriers to entry are: • Natural • Scale economies • Patents • Technology • Name recognition Chapter 12
Oligopoly • The barriers to entry are: • Strategic action • Flooding the market • Controlling an essential input Chapter 12
Oligopoly • Management Challenges • Strategic actions • Rival behavior • Question • What are the possible rival responses to a 10% price cut by Ford? Chapter 12
Oligopoly • Equilibrium in an Oligopolistic Market • In perfect competition, monopoly, and monopolistic competition the producers did not have to consider a rival’s response when choosing output and price. • In oligopoly the producers must consider the response of competitors when choosing output and price. Chapter 12
Oligopoly • Equilibrium in an Oligopolistic Market • Defining Equilibrium • Firms doing the best they can and have no incentive to change their output or price • All firms assume competitors are taking rival decisions into account. Chapter 12
Oligopoly • Nash Equilibrium • Each firm is doing the best it can given what its competitors are doing. Chapter 12
Oligopoly • The Cournot Model • Duopoly • Two firms competing with each other • Homogenous good • The output of the other firm is assumed to be fixed Chapter 12
If Firm 1 thinks Firm 2 will produce nothing, its demand curve, D1(0), is the market demand curve. D1(0) If Firm 1 thinks Firm 2 will produce 50 units, its demand curve is shifted to the left by this amount. If Firm 1 thinks Firm 2 will produce 75 units, its demand curve is shifted to the left by this amount. MR1(0) D1(75) MR1(75) MC1 MR1(50) D1(50) 12.5 25 50 Firm 1’s Output Decision P1 What is the output of Firm 1 if Firm 2 produces 100 units? Q1 Chapter 12
Oligopoly • The Reaction Curve • A firm’s profit-maximizing output is a decreasing schedule of the expected output of Firm 2. Chapter 12
Firm 1’s reaction curve shows how much it will produce as a function of how much it thinks Firm 2 will produce. The x’s correspond to the previous model. Firm 2’s reaction curve shows how much it will produce as a function of how much it thinks Firm 1 will produce. Firm 2’s Reaction Curve Q*2(Q2) In Cournot equilibrium, each firm correctly assumes how much its competitors will produce and thereby maximize its own profits. x Cournot Equilibrium x Firm 1’s Reaction Curve Q*1(Q2) x x Reaction Curves and Cournot Equilibrium Q1 100 75 50 25 Q2 25 50 75 100 Chapter 12
Oligopoly • Questions 1) If the firms are not producing at the Cournot equilibrium, will they adjust until the Cournot equilibrium is reached? 2) When is it rational to assume that its competitor’s output is fixed? Chapter 12
Oligopoly The Linear Demand Curve • An Example of the Cournot Equilibrium • Duopoly • Market demand is P = 30 - Q where Q = Q1 + Q2 • MC1 = MC2 = 0 Chapter 12
Oligopoly The Linear Demand Curve • An Example of the Cournot Equilibrium • Firm 1’s Reaction Curve Chapter 12
Oligopoly The Linear Demand Curve • An Example of the Cournot Equilibrium Chapter 12
Oligopoly The Linear Demand Curve • An Example of the Cournot Equilibrium Chapter 12
30 Firm 2’s Reaction Curve Cournot Equilibrium 15 10 Firm 1’s Reaction Curve 10 15 30 Duopoly Example Q1 The demand curve is P = 30 - Q and both firms have 0 marginal cost. Q2 Chapter 12
Oligopoly Profit Maximization with Collusion Chapter 12
Oligopoly Profit Maximization with Collusion • Contract Curve • Q1 + Q2 = 15 • Shows all pairs of output Q1 and Q2 that maximizes total profits • Q1 = Q2 = 7.5 • Less output and higher profits than the Cournot equilibrium Chapter 12
Firm 2’s Reaction Curve For the firm, collusion is the best outcome followed by the Cournot Equilibrium and then the competitive equilibrium Competitive Equilibrium (P = MC; Profit = 0) 15 Cournot Equilibrium Collusive Equilibrium 10 7.5 Firm 1’s Reaction Curve Collusion Curve 7.5 10 15 Duopoly Example Q1 30 Q2 30 Chapter 12
First Mover Advantage--The Stackelberg Model • Assumptions • One firm can set output first • MC = 0 • Market demand is P = 30 - Q where Q = total output • Firm 1 sets output first and Firm 2 then makes an output decision Chapter 12
First Mover Advantage--The Stackelberg Model • Firm 1 • Must consider the reaction of Firm 2 • Firm 2 • Takes Firm 1’s output as fixed and therefore determines output with the Cournot reaction curve: Q2 = 15 - 1/2Q1 Chapter 12
First Mover Advantage--The Stackelberg Model • Firm 1 • Choose Q1so that: Chapter 12
First Mover Advantage--The Stackelberg Model • Substituting Firm 2’s Reaction Curve for Q2: Chapter 12
First Mover Advantage--The Stackelberg Model • Conclusion • Firm 1’s output is twice as large as firm 2’s • Firm 1’s profit is twice as large as firm 2’s • Questions • Why is it more profitable to be the first mover? • Which model (Cournot or Shackelberg) is more appropriate? Chapter 12
Price Competition • Competition in an oligopolistic industry may occur with price instead of output. • The Bertrand Model is used to illustrate price competition in an oligopolistic industry with homogenous goods. Chapter 12
Price Competition Bertrand Model • Assumptions • Homogenous good • Market demand is P = 30 - Q where Q = Q1 + Q2 • MC = $3 for both firms and MC1 = MC2 = $3 Chapter 12
Price Competition Bertrand Model • Assumptions • The Cournot equilibrium: • Assume the firms compete with price, not quantity. Chapter 12
Price Competition Bertrand Model • How will consumers respond to a price differential? (Hint: Consider homogeneity) • The Nash equilibrium: • P = MC; P1 = P2 = $3 • Q = 27; Q1 & Q2 = 13.5 Chapter 12
Price Competition Bertrand Model • Why not charge a higher price to raise profits? • How does the Bertrand outcome compare to the Cournot outcome? • The Bertrand model demonstrates the importance of the strategic variable (price versus output). Chapter 12
Price Competition Bertrand Model • Criticisms • When firms produce a homogenous good, it is more natural to compete by setting quantities rather than prices. • Even if the firms do set prices and choose the same price, what share of total sales will go to each one? • It may not be equally divided. Chapter 12
Price Competition • Price Competition with Differentiated Products • Market shares are now determined not just by prices, but by differences in the design, performance, and durability of each firm’s product. Chapter 12
Price Competition Differentiated Products • Assumptions • Duopoly • FC = $20 • VC = 0 Chapter 12
Price Competition Differentiated Products • Assumptions • Firm 1’s demand is Q1= 12 - 2P1 + P2 • Firm 2’s demand is Q2 = 12 - 2P1 + P1 • P1 and P2 are prices firms 1 and 2 charge respectively • Q1 and Q2 are the resulting quantities they sell Chapter 12
Price Competition Differentiated Products • Determining Prices and Output • Set prices at the same time Chapter 12
Price Competition Differentiated Products • Determining Prices and Output • Firm 1: If P2is fixed: Chapter 12
Firm 2’s Reaction Curve Collusive Equilibrium $6 $4 Firm 1’s Reaction Curve Nash Equilibrium $4 $6 Nash Equilibrium in Prices P1 P2 Chapter 12
Nash Equilibrium in Prices • Does the Stackelberg model prediction for first mover hold when price is the variable instead of quantity? • Hint: Would you want to set price first? Chapter 12
A Pricing Problem for Procter & Gamble Differentiated Products • Scenario 1) Procter & Gamble, Kao Soap, Ltd., and Unilever, Ltd were entering the market for Gypsy Moth Tape. 2) All three would be choosing their prices at the same time. Chapter 12
A Pricing Problem for Procter & Gamble Differentiated Products • Scenario 3) Procter & Gamble had to consider competitors prices when setting their price. 4) FC = $480,000/month and VC = $1/unit for all firms Chapter 12
A Pricing Problem for Procter & Gamble Differentiated Products • Scenario 5) P&G’s demand curve was: Q = 3,375P-3.5(PU).25(PK).25 • Where P, PU , PKare P&G’s, Unilever’s, and Kao’s prices respectively Chapter 12
A Pricing Problem for Procter & Gamble Differentiated Products • Problem • What price should P&G choose and what is the expected profit? Chapter 12
P&G’s Profit (in thousands of $ per month) Competitor’s (Equal) Prices ($) P&G’s Price ($) 1.10 1.20 1.30 1.40 1.50 1.60 1.70 1.80 1.10 -226 -215 -204 -194 -183 -174 -165 -155 1.20 -106 -89 -73 -58 -43 -28 -15 -2 1.30 -56 -37 -19 2 15 31 47 62 1.40 -44 -25 -6 12 29 46 62 78 1.50 -52 -32 -15 3 20 36 52 68 1.60 -70 -51 -34 -18 -1 14 30 44 1.70 -93 -76 -59 -44 -28 -13 1 15 1.80 -118 -102 -87 -72 -57 -44 -30 -17
A Pricing Problem for Procter & Gamble • What Do You Think? 1) Why would each firm choose a price of $1.40? Hint: Think Nash Equilibrium 2) What is the profit maximizing price with collusion? Chapter 12
Competition Versus Collusion:The Prisoners’ Dilemma • Why wouldn’t each firm set the collusion price independently and earn the higher profits that occur with explicit collusion? Chapter 12
Competition Versus Collusion:The Prisoners’ Dilemma • Assume: Chapter 12
Competition Versus Collusion:The Prisoners’ Dilemma • Possible Pricing Outcomes: Chapter 12
$12, $12 $20, $4 $4, $20 $16, $16 Payoff Matrix for Pricing Game Firm 2 Charge $4 Charge $6 Charge $4 Firm 1 Charge $6 Chapter 12
Competition Versus Collusion:The Prisoners’ Dilemma • These two firms are playing a noncooperative game. • Each firm independently does the best it can taking its competitor into account. • Question • Why will both firms both choose $4 when $6 will yield higher profits? Chapter 12