Download
1 / 16
160 likes | 291 Vues
Complex 2D Fields: Analysis of Eddies in the Southern Indian Ocean. Project Leader: Greta Leber Joni Lum Changheng Chen David Yeomans Amelia Nahmias. Eddies in the Agulhas Current Background Info. The Agulhas Current is the Western Boundary Current (WBC) for the Southern Indian Ocean.

E N D
Complex 2D Fields:Analysis of Eddies in the Southern Indian Ocean Project Leader: Greta Leber Joni Lum ChanghengChen David Yeomans Amelia Nahmias
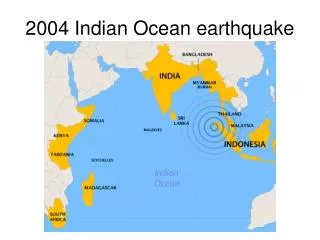
Eddies in the Agulhas CurrentBackground Info The Agulhas Current is the Western Boundary Current (WBC) for the Southern Indian Ocean. It flows down the East Coast of Africa from ~27°S to 40°S (Gordon, 1985) It is the strongest WBC in the world (Bryden & Beal, 2005) Transport: 73 Sverdrups (Beal & Bryden, 1999) Max Velocity: 2m/s (Bryden & Beal, 2005) Depth: ~2300m (Donohue et al., 2000)
Eddies in the Agulhas CurrentBackground Info • Eddies near the tip of South Africa are called “Agulhas Rings” and those found on either side of Madagascar are “Madagascar & Mozambique Channel Eddies” • These warm-core rings are pinched-off anticyclones that can be 320km in diameter and contain water that is 5° warmer and has 0.3 psu greater salinity than surrounding waters (Gordon, 1985) • This warm-water link between the Atlantic & Indian Oceans is likely to have a strong influence on global climate patterns (Gordon, 1985)
Eddies in the Agulhas CurrentBackground Info The dataset used is a Delayed Time Map of Absolute Dynamic Topography from the SSALTO/Data Unification and Altimeter Combination System (DUACS) satellite, restricted from 10°S - 45°S, 10°E - 55°E It was funded by the European Commission, beginning in Feb. 1997 The data is devoted to scientific, non-commercial use to study ocean variability (mesoscale circulation, seasonal variability, El Nino…) We use 1/4°x1/4° AVISO data
Eddy Identification: SSHA and Boolean Fields The SSH anomaly (SSHA) field was calculated by subtracting the local time-mean at each grid point. Eddies were then defined as anomalies larger than 20 cm (negative cyclonic, positive anticyclonic) • Two separate Boolean fields were defined: One each where cyclones and then anticyclones had been replaced by 1s (with zeros elsewhere)
Eddy Identification: Variables from Boolean Fields • probability maps of where eddies are likely to be present: From the simple Boolean fields, one can create:
Eddy Identification: Variables from Boolean Fields • Ortime series of number of pixels (~area) representing a cyclone or anticyclone.
Eddy Identification: bwconncomp function • Matlab’sbwconncomp (binary image connected components) will take these boolean fields as inputs and give as one of its outputs (in this case) the number of anticyclones or cyclones at each time step: • Their sum, then, is the total number of eddies over time:
Correlation between number/area of cyclonic and anticyclonic eddies Correlation coefficient = -0.4773 % weak anticorrelation Correlation coefficient = -0.7939 % strong anticorrelation
Anticorrelation of cyclonic and anticyclonic eddies Slope of number of cyclonic eddies = -0.0014 Slope of number of anticyclonic eddies = 0.0017 Slope of area of cyclonic eddies = -0.1065 Slope of area of anticyclonic eddies = 0.1490
Conclusions • A simple analysis of a complex 2D field reveals some interesting trends: • A strong anticorrelation between the area of anticyclonic and cyclonic eddies over time is found. Though this is most likely due to how eddies were defined, it is suggestive of a broader trend. • Number of Cyclonic and Anticyclonic eddies, on their own, as well as total area of eddies over time, have distinct annual cycles. • Size distribution analysis reveals that large eddies are much less common than small eddies. Again, this is possibly due to how eddies were defined (large anomalies are less likely than small ones) but it is suggestive. • Complex 2D fields show a lot of variability (first 10 EOFs only explain 30% of the total variance), with most variability, in this case, contained within the Agulhas Return Current (as it fluctuates northward and southward).