Download
1 / 30
300 likes | 316 Vues
Survey results on older adults' healthcare needs, financial challenges, and insurance issues from The Commonwealth Fund Survey of Older Adults in 2004.

E N D
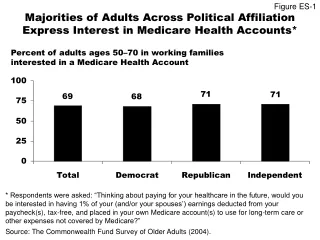
Figure ES-1 Majorities of Adults Across Political AffiliationExpress Interest in Medicare Health Accounts* Percent of adults ages 50–70 in working families interested in a Medicare Health Account * Respondents were asked: “Thinking about paying for your healthcare in the future, would you be interested in having 1% of your (and/or your spouses’) earnings deducted from your paycheck(s), tax-free, and placed in your own Medicare account(s) to use for long-term care or other expenses not covered by Medicare?” Source: The Commonwealth Fund Survey of Older Adults (2004).
Figure ES-2 Percent of Adults Ages 50–64 Who Are Very/Somewhat Interested in Receiving Medicare Before Age 65, by Insurance Status and Income Percent of adults ages 50–64and not on Medicare 94 86 84 81 73 73 68 66 Total Employer Individual Uninsured Less than $25,000 $25,000–$39,999 $40,000–$59,999 $60,000or more Source: The Commonwealth Fund Survey of Older Adults (2004).
Figure ES-3 Access Problems Because of Cost Percent of adults who had any of four access problems*in past year because of cost * Did not fill a prescription; did not see a specialist when needed; skipped medical test, treatment, or follow-up; did not see doctor when sick. Source: The Commonwealth Fund Survey of Older Adults (2004).
Figure ES-4 More than One-Third of Older AdultsReport Medical Bill Problems Percent of adults ages 50–70 with any medical bill problemsor outstanding medical debt* * Problems paying/not able to pay medical bills, contacted by a collection agency for medical bills, had to change way of life to pay bills, or has medical debt being paid off over time. Source: The Commonwealth Fund Survey of Older Adults (2004).
Figure 1 Older Adults Have High Ratesof Chronic Conditions* Total <200% poverty 200% poverty or more Percent of adults with a chronic condition* Ages 50–70 Ages 50–64 Ages 65–70 * Includes hypertension/high blood pressure, heart disease/heart attack, cancer, diabetes, arthritis, or high cholesterol. Source: The Commonwealth Fund Survey of Older Adults (2004).
Figure 2 Insurance Instability Among Adults Ages 50–64Is Highest Among Those with Low Incomes Percent of adults ages 50–64 51 31 25 18 6 Total Less than $25,000 $25,000–39,999 $40,000–$59,999 $60,000or more Note: Income groups based on 2003 household income. Source: The Commonwealth Fund Survey of Older Adults (2004).
Figure 3 More than Half of Older Adults withIndividual Coverage Spend $3,600 or MoreAnnually on Premiums Percent of insured adults ages 50–70 54 17 16 6 Source: The Commonwealth Fund Survey of Older Adults (2004).
Figure 4 More than Two of Five Older Adults with Individual Coverage Have Annual Deductibles of $1,000 or More Percent of insured adults ages 50–70 54 19 18 9 Source: The Commonwealth Fund Survey of Older Adults (2004).
Figure 5 Annual Out-of-Pocket Medical Expenses,Including Prescription Drugs* Percent of insured adults ages 50–70 36 35 22 22 20 * Does not include premiums. Source: The Commonwealth Fund Survey of Older Adults (2004).
Figure 6 Percent of Insured Older AdultsWho Are “Underinsured”* Percent of insured adults 50–70 * Defined as “underinsured” if: 1) medical expenses (excluding premiums) represent 10% or more of income; 2) medical expenses (excluding premiums) for low income (<200% FPL) represent 5% or more of income; or 3) deductible represents 5% or more of income. Based on C. Schoen et al., “Insured But Not Protected: How Many Adults Are Underinsured?” Health Affairs Web Exclusive (June 14, 2005): W5-289–W5-302. Source: The Commonwealth Fund Survey of Older Adults (2004).
Figure 7 Access Problems Because of Cost Percent of adults who had any of four access problems*in past year because of cost * Did not fill a prescription; did not see a specialist when needed; skipped medical test, treatment, or follow-up; did not see doctor when sick. Source: The Commonwealth Fund Survey of Older Adults (2004).
Figure 8 Access Problems in Past Year,by Size of Deductible Percent who had any of four access problems*in past year because of costs * Did not fill a prescription; did not see a specialist when needed; skipped medical test, treatment, or follow-up; did not see doctor when sick. Source: The Commonwealth Fund Survey of Older Adults (2004).
Figure 9 More than One-Third of Older AdultsReport Medical Bill Problems Percent of adults ages 50–70 with any medical bill problemsor outstanding medical debt* * Problems paying/not able to pay medical bills, contacted by a collection agency for medical bills, had to change way of life to pay bills, or has medical debt being paid off over time. Source: The Commonwealth Fund Survey of Older Adults (2004).
Figure 10 Medical Bill or Debt Problems in Past Year,by Size of Deductible Percent of insured adults ages 50–70 withany medical bill problem or outstanding debt* * Problems paying/not able to pay medical bills, contacted by a collection agency for medical bills, had to change way of life to pay bills, or has medical debt being paid off over time. Source: The Commonwealth Fund Survey of Older Adults (2004).
Figure 11 Percent of Medicare BeneficiariesWho Were Uninsured Just Before Medicare Percent of Medicare beneficiaries ages 50–70 Source: The Commonwealth Fund Survey of Older Adults (2004).
Figure 12 Importance of Becoming Eligible for Medicare Percent of Medicare beneficiaries ages 50–70 who saidit was “very important” to become eligible for Medicare Source: The Commonwealth Fund Survey of Older Adults (2004).
Figure 13 Ratings of Insurance Coverage Percent of adults rating insurance coverage“excellent” or “very good” 57 55 55 32 Source: The Commonwealth Fund Survey of Older Adults (2004).
Figure 14 Medicare Beneficiaries and Older Adultswith Employer Coverage Are Most Satisfiedwith Health Care Quality Percent who said they were “very satisfied” with their health care Source: The Commonwealth Fund Survey of Older Adults (2004).
Figure 15 Medicare Beneficiaries and Older Adultswith Employer-Sponsored Coverage AreMost Confident in Getting the Best Medical Care Percent reporting they were “very confident”in getting the best medical care Source: The Commonwealth Fund Survey of Older Adults (2004).
Figure 16 Two of Five Older Adults Are Not Confidentin Their Retirement Security: Older Adultswith Low Incomes Are the Least Confident Percent of adults who are not too or not at all confident they’ll have enough income and savings to live comfortably in retirement Total <200% poverty 200% poverty or more Ages 50–70 Ages 50–64 Ages 65–70 Source: The Commonwealth Fund Survey of Older Adults (2004).
Figure 17 Total Bank or Stock Market Savings Percent of adults ages 50–70 with savings of the following amounts Don’t know/Refused 16% Less than $25,000 38% $100,000 or more 25% $25,000–$49,999 10% $50,000–$99,999 11% Source: The Commonwealth Fund Survey of Older Adults (2004).
Figure 18 Total Bank or Stock Market Savings, by Income, Adults Ages 50–70 Don’t know/ Refused 10% Don’t know/Refused 7% Less than $25,000 80% Less than $25,000 26% $100,000 or more 2% $50,000– $99,999 5% $25,000–$49,999 13% $25,000–$49,999 6% $100,000 or more 37% $50,000–$99,999 14% Less than 200% Poverty 200% Poverty or More Source: The Commonwealth Fund Survey of Older Adults (2004).
Figure 19 The Quality of Retiree Health BenefitsIs Eroding Percent of adults ages 50–70 with retiree health benefitsor who expect to have them Source: The Commonwealth Fund Survey of Older Adults (2004).
Figure 20 Majorities of Older Adults Are WorriedThey Won’t Be Able to Afford Needed Medical Care Percent “very/somewhat worried” about affording medical care 77 71 67 64 63 56 51 Source: The Commonwealth Fund Survey of Older Adults (2004).
Figure 21 Interest in Medicare Health AccountsIs Strong Across Income Group* Percent of adults ages 50–70 in working families interested in a Medicare Health Account * Respondents were asked: “Thinking about paying for your healthcare in the future, would you be interested in having 1% of your (and/or your spouses’) earnings deducted from your paycheck(s), tax-free, and placed in your own Medicare account(s) to use for long-term care or other expenses not covered by Medicare?” Source: The Commonwealth Fund Survey of Older Adults (2004).
Figure 22 Percent of Adults Ages 50–64 Who Are Very/Somewhat Interested in Receiving Medicare Before Age 65, by Insurance Status and Income Percent of adults ages 50–64and not on Medicare 94 86 84 81 73 73 68 66 Total Employer Individual Uninsured Less than $25,000 $25,000–$39,999 $40,000–$59,999 $60,000or more Source: The Commonwealth Fund Survey of Older Adults (2004).
Figure 23 Amount Willing to Pay to Buy into MedicareBefore Age 65 Note: Columns may not sum properly because of rounding. Source: The Commonwealth Fund Survey of Older Adults (2004).
Figure 24 How Interested Would You Be in Payingan Extra $100 per Month to Medicare to HaveAll Your Health Services, Including Rx, Covered? Percent of respondents on Medicare Don’t know/Refused 3% Very interested 25% Not at all interested 34% Somewhat interested 25% Not too interested13% Source: The Commonwealth Fund Survey of Older Adults (2004).
Figure 25 If Medicare or Your Insurance Plan Charged You a Lower Monthly Premium If You Agreed to Go to Doctors That Provided the Best Care at the Lowest Cost, Would You Participate, Even If It Meant You Had to Change Doctors? Percent of adults ages 50–70 who responded yes Source: The Commonwealth Fund Survey of Older Adults (2004).
Figure 26 Should Medicare or Your Insurance PlanRequire You to Sign Up for a DoctorWho Would Be Your Regular Source of Care? Percent of adults ages 50–70 who responded yes Source: The Commonwealth Fund Survey of Older Adults (2004).