Download

1 / 47
470 likes | 1.11k Vues
Understanding financial statements through horizontal, vertical analyses for evaluation and benchmarking with industry and competitors to aid in strategic financial decision-making.

E N D
Chapter 15 Financial Statement Analysis
Financial Statement Analysis • To make informed decisions about a company • Helpful in managing the company • Comparison with competition • Charting a company’s progress, measure performance • Establish financial health • Used for investment decisions • Generally based on comparative financial data • From one year to the next • With a competing company • With the industry as a whole.
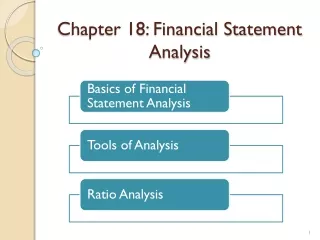
Financial Statement Analysis • Three main ways to analyze financial statements • Horizontal analysis • Vertical analysis • Using industry averages
Horizontal Analysis • The study of percentage changes in comparative statements • Compute dollar changes • Compute percentage changes
Example: Income Statement • Step 1 • Step 2
Trend Percentages • Form of horizontal analysis • Select a period of three to five years • Base year, earliest year, is selected and set equal to 100% • Subsequent years expressed as a percentage of the base period
E15-13: Horizontal analysis—income statement Data for Mariner Designs, Inc., follow: 1. Prepare a horizontal analysis of the comparative income statement of Mariner Designs, Inc. Round percentage changes to one decimal place.
E15-13: Horizontal analysis—income statement Data for Mariner Designs, Inc., follow: 2. Why did 2012 net income increase by a higher percentage than net sales revenue? Revenues increase at a higher rate than total expenses.
Vertical Analysis • Shows relationship of each item to a base amount on financial statements • Income statement–each item expressed as percentage of net sales • Balance sheet–each item expressed as percentage of total assets or total liabilities and equity.
Example: Income Statement • Base amount • Percentage of the base amount
Example: Balance Sheet • Base amount • Percentage of base
S15-3 : Vertical analysis Tri-State Optical Company reported the following amounts on its balance sheet at December 31, 2012 and 2011: Prepare a vertical analysis of Tri-State assets for 2012 and 2011. 26.6 20.7 52.7 100.0 28.4 19.8 51.8 100.0
Common-Size Statements • Common-size statements compare one company to another
Benchmarking • Comparing a company with another leading company • Two main types: • Against a key competitor • Against the industry average
S15-4 :Common-size income statement Data for Martinez, Inc., and Rosado, Corp., follow: 1. Prepare common-size income statements.
S15-4 :Common-size income statement (Continued) 2. Which company earns more net income? 3. Which company’s net income is a higher percentage of its net sales? Rosado Martinez
Financial Ratios • No single ratio tells the whole picture • Different ratios explain different aspects
Ability to Pay Current Liabilities • Working capital Working capital = Current assets – Current liabilities • Current ratio Current assets Current liabilities Current ratio =
Ability to Pay Current Liabilities • Acid-test ratio Acid-test Ratio Cash + Short-term investments + Net current receivables Current liabilities =
Ability to Sell Inventory and Collect Receivables • Inventory turnover ratio • Formula Cost of goods sold Average inventory Inventory turnover =
Ability to Sell Inventory and Collect Receivables • Days in inventory ratio • Formula Days in inventory = 365 days Inventory turnover ratio
Ability to Sell Inventory and Collect Receivables • Gross profit percentage • Formula Gross profitNet sales Gross profit percentage =
Ability to Sell Inventory and Collect Receivables • Accounts receivable turnover ratio • Formula Net credit sales Average net accounts receivable Accounts receivable turnover =
Ability to Sell Inventory and Collect Receivables • Days’ sales in receivables ratio • Formula Days’ sales in average accounts = receivable 365 days Accounts receivable turnover ratio
Ability to Pay Long-Term Debt • Debt ratio • Formula • Average debt ratio ranges from 57% to 67% Total liabilities Total assets Debt ratio =
Ability to Pay Long-Term Debt • Debt to equity ratio • Formula Total liabilities Total equity Debt to equity =
Ability to Pay Long-Term Debt • Times-interest-earned ratio • Formula Earnings Before Interest and Taxes Interest expense Times-interest earned ratio =
Measuring Profitability • Return on net sales • Formula Rate of return on net sales Net income Net sales =
Measuring Profitability • Return on total assets • Formula Rate of return on total assets Net income + Interest expense Average total assets =
Measuring Profitability • Asset turnover ratio • Formula Net sales Average total assets Asset turnover ratio =
Measuring Profitability • Return on common stockholders’ equity • Formula Rate of return on common stockholders’ equity Net income – Preferred dividends Average common stockholders’ equity =
Leverage • Trading on the equity • Increases profits during goods times • Compounds losses during bad times
Measuring Profitability • Earnings per share • Formula Net income – Preferred Dividends Number of shares of common stock outstanding Earnings per shareof common stock =
Analyzing Stock Investments • Price/earnings ratio (P/E) • Formula Market price per share of common stock Earnings per share P/E ratio =
Analyzing Stock Investments • Dividend yield • Formula Dividend yield on common stock Annual dividends per share of common stock Market price per share of common stock =
Analyzing Stock Investments • Dividend Payout • Formula Annual dividends per share Earnings per share Dividend Payout =
Analyzing Stock Investments • Book value • Formula Book value per share of common stock Total stockholders’ equity – Preferred equity Number of shares of common stock outstanding =
S15-5: Evaluating current ratio Win’s Companies, a home improvement store chain, reported the following summarized figures:
S15-5 : Evaluating current ratio (Continued) • Compute Win’s Companies’ current ratio at May 31, 2012 and 2011. 2. Did Win’s Companies’ current ratio improve, deteriorate, or hold steady during 2012? • - $ 54,300,000/$ 33,000,000 = 1.65 2011 - $ 25,200,000/$ 13,100,000 = 1.92 Current assets Current liabilities Current ratio = Win’s Companies current ratio deteriorated.
S15-6: Computing inventory, gross profit, and receivables ratios Use the Win’s Companies data in Short Exercise 15-5 to complete the following requirements. • Compute the rate of inventory turnover, days in inventory, and gross profit percentage for 2012. Gross profitNet sales Days in inventory = 365 days Inventory turnover ratio Gross profit percentage = Cost of goods sold Average inventory $ 28,400,000/($6,900,000 + $8,200,000)/2 = 3.76 Inventory turnover = 365/3.76 = 97 days $21,800,000/$50,200,000 = 43.4 %
S15-6 : Computing inventory, gross profit, and receivables ratios (Continued) 2. Compute days’ sales in average receivables during 2012. Round dollar amounts to three decimal places. Days’ sales in average accounts = receivable Net credit sales Average net accounts receivable 365 days Accounts receivable turnover ratio Accounts receivable turnover = 365/($ 50,200,000/($7,400,000 + $5,300,000)/2 ) = 46 days
S15-7: Measuring ability to pay liabilities Use the financial statements of Win’s Companies in Short Exercise 15-5. • Compute the debt ratio and the debt to equity ratio at May 31, 2012. 2. Is Win’s ability to pay its liabilities strong or weak? Explain your reasoning. Total liabilities Total equity Total liabilities Total assets Debt to equity = Debt ratio = $ 45,300,000 / $ 88,300,000 = 51.3 $ 45,300,000 / $ 43,000,000 = 1.05 The company’s ability to pay its liabilities is strong since the debt ratio is low.
S15-8 : Measuring profitability Use the financial statements of Win’s Companies in Short Exercise 15-5 to complete the following profitability measures for 2012. 1. Compute the rate of return on net sales. 2. Compute the rate of return on total assets. 3. Compute the asset turnover ratio. Rate of return on net sales Net income Net sales Rate of return on total assets $ 15,500,000 / $ 50,200,000 = 30.9% Net income + Interest expense Average total assets Net sales Average total assets = = Asset turnover ratio = $ 15,500,000 + 500,000 / ($ 88,300,000 + $ 51,200,000)/2 = 22.9% $ 50,200,000 / ($ 88,300,000 + $ 51,200,000)/2 = 0.72
S15-8 : Measuring profitability (Continued) 4. Compute the rate of return on common stockholders’ equity. 5. Are these rates of return strong or weak? Explain your reasoning. Rate of return on common stockholders’ equity Net income – Preferred dividends Average common stockholders’ equity = $ 15,500,000 – 0 / ($ 43,000,000 + $ 27,500,000) /2 = 44.0 % These rates of return are strong considering that average companies present much lower rates of return.
S15-9 : Computing EPS and P/E ratio Use the financial statements of Win’s Companies in Short Exercise 15-5. Win’s has 500,000 common shares outstanding during 2012. • Compute earnings per share (EPS) for Win’s. Round to the nearest cent. 2. Compute Win’s Companies’ price/earnings ratio. The market price per share of Win’s stock is $68.50. Market price per share of common stock Earnings per share P/E ratio = Net income – Preferred Dividends Number of shares of common stock outstanding $ 15,500,000 – 0/500,000 = $31.00 Earnings per shareof common stock = $68.50/$31.00 = 2.2 times