Download
1 / 9
90 likes | 108 Vues
This study investigates the use of roughness length for diagnosing T2M in a typical SYNOP station. It analyzes the daily cycle of temperature and humidity, as well as the difference between T2M forecasts and SYNOP-observations.

E N D
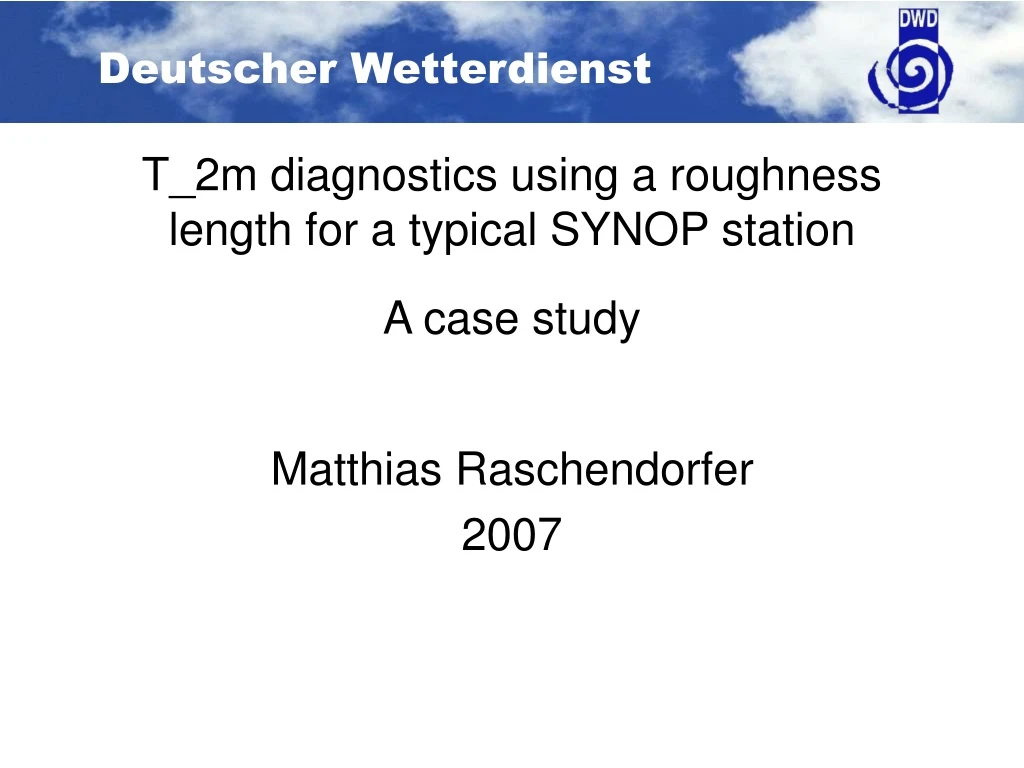
T_2m diagnostics using a roughness length for a typical SYNOP stationA case study Matthias Raschendorfer 2007
T_2M [0C] z0d = 0.02 m ANA city point FCT minus ANA EXP minus ANA
Daily cycle of PBL profiles of temperature and humidity Difference of T2m forecast compared to SYNOP-observations Daily cycle of T2m, TD2m Interpolation: model levels to 2m Turbulence model SMA Modification of Bowen ratio, i.e. relation between sensible and latent heat flux Soil humidity other evaporation parameters: stomata resistance, PLCOV, LAI, root depth, (sealing of the soil), soil type, …
TD_2M [0C] average over land points test with reduced evaporation ana routi exp still too much evaporation
temporal evolution of TD_2M [0C] average over land points test with reduced evaporation and z0d=0.02m ana routi exp still too much evaporation or too stable profile at noon
temporal evolution of T_2M [0C] average over land points test with reduced evaporation and z0d=0.02 m ana routi exp more stable profile at night more unstable profile at noon more stable profile at night more stable profile at night still too much evaporation still too much evaporation
Summary: • BL is generally too moist and cold, but diagnosed T_2m is too high at noon. • The problem is most visible at grid points with large z0 and unrealistically moist soil. • T_2m is too high during night. • TD_2m is too high throughout the whole day. • T_2m is too close to surface temperature at noon, in particular for rough surfaces. • SMA alleviates this defect by moistening the soil until saturation is reached. • If evaporation is reduced in order to obtain more realistic BL profiles, • T_2m at noon will be overestimated in general, but mainly for large z0. • SYNOP-station profiles pushes T_2m farther away from the surface value for large z0. • To get lower T_2m mainly at night, we need a stronger dependency on stability. • Use an inverse linear function for turbulent velocity scale at stable stratification. • Don’t use turbulent properties above the lowest full model level. • This is work in progress now.
GME Verification of T2M: Routine, i.e. z0=z0(grid average) for T2M diagnosis
GME Verification of T2M: Experiment, i.e. z0=z0(SYNOP station) for T2M diagnosis