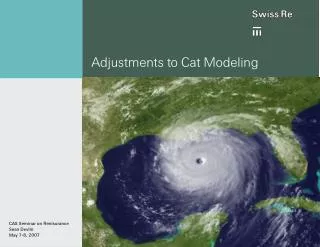
Adjustments to Cat Modeling
Learn about model selection, benefits, drawbacks, and adjustments for climate prediction and unmodeled perils in reinsurance deals. Explore the advantages and challenges of using one model exclusively or by territory, as well as the impact of different modeling firms.


Adjustments to Cat Modeling
E N D
Presentation Transcript
Adjustments to Cat Modeling CAS Seminar on Renisurance Sean Devlin May 7-8, 2007
Model Selection • Major modeling firms • AIR • EQE • RMS • Other models, including proprietary • Options in using the models • Use one model exclusively • Use one model by “territory” • Use multiple models for each account
Model Selection • Use One Model Exclusively • Benefits • Simplify process for each deal • Consistency of rating • Lower cost of license • Accumulation easier • Running one model for each deal involves less time • Drawbacks • Can’t see differences by deal and in general • Conversion of data to your model format
Model Selection • Use One Model By “Territory” • Detailed review of each model by “territory” • Territory examples (EU wind, CA EQ, FL wind) • Select adjustment factors for the chosen model • Benefits • Simplify process for each deal • Consistency of rating • Accumulation easier • Running one model involves less time • Drawbacks • Can’t see differences by deal • Conversion of data to your model format
Model Selection Use One Model By “Territory” – An Example
Model Selection • Use Multiple Models • Benefits • Can see differences by deal and in general • Drawbacks • Consistency of rating? • Conversion of data to each model format • Simplify process for each deal • High cost of licenses • Accumulation difficult • Running one model for each deal is time consuming
Climate and Hurricane Prediction
TCNA Adjustments - Climate Despite impressive science, the individual season predictions, the last two years was off the mark. 2005 2006
TCNA Adjustments - Climate • Option 1 - Find no credibility in the forecasts • Use a vendor model based on long term climate • Adjust the loss curve down of a vendor model that has increased frequency/severity • Use own model • A blend of the above
TCNA Adjustments - Climate • Option 2- Believe that the forecasts are directionally correct • Credibility weighting between models in option 1 and a model with frequency adjustments • Adjust a long-term model for frequency/severity • Adjust long-term version of a vendor model • Adjust own model for frequency/severity • Combination of the above
TCNA Adjustments - Climate • Option 3 - Believe completely in the multi-year forecasts • Implement a vendor model with a multi-year view • Make frequency/severity adjustments to a long term vendor model • Adjust own model • Blend of the above
TCNA Adjustments - Climate • Option 4 - Believe completely in the single year forecasts • Implement seasonal forecast version for a vendor model • Adjust vendor model for frequency/severity • Adjust internal model for frequency/severity • Combination of the above
TCNA Adjustments – Frequency/Severity • Adjust whole curve equally • Ignores shape change • Treats all regions equally • Adjust whole curve by return period/region
Modeled Perils – Other Adjustments • Actual vs. Modeled – look for biases (Macro/Micro) • Model recent events with actual portfolio • More confidence on gross results, but some insight may be gained on per risk basis • One or two events may show a material upward miss. Key is to understand why. • Exposure Changes / Missing Exposure/ITV Issues • TIV checks/audits • Scope of data – international, all states & perils • Changes in exposure, important for specialty writers
Modeled Perils – Other Adjustments • Other Biases in modeling • LAE • Fair plans/pools/assessments – know what is covered by client and treaty prospectively • FHCF – Reflect all probable outcomes of recovery • Storm Surge • Demand Surge • Pre Event • Post Event
“Unmodeled” Exposure • Tornado/Hail • Winter Storm • Wildfire • Flood • Terrorism • Fire Following • Other
Unmodeled Perils Tornado Hail • National writers tend not to include TO exposures • Models are improving, but not quite there yet • Significant exposure • Frequency: TX • Severity: • 2003: 3.2B • 2001: 2.2B • 2002: 1.7B • Methodology • Experience and exposure ate • Compare to peer companies with more data • Compare experience data to ISO wind history • Weight methods
Unmodeled Perils Winter storm • Not insignificant peril in some areas, esp. low layers • 1994: 100M, 175M, 800M, 105M • 1993: 1.75B • 1996: 600M, 110M, 90M, 395M • 2003: 1.6B • # of occurrences in a cluster????? • Possible Understatement of PCS data • Methodology • Degree considered in models • Evaluate past event return period(s) • Adjust loss for today’s exposure • Fit curve to events • Aggregate Cover?????
Unmodeled Perils Wildfire • Not just CA • Oakland Fires: 1.7B • Development of land should increase freq/severity • Two main loss drivers • Brush clearance – mandated by code • Roof type (wood shake vs. tiled) • Methodology • Degree considered in models • Evaluate past event return period(s), if possible • Incorporate Risk management, esp. changes • No loss history - not necessarily no exposure
Unmodeled Perils Flood • Less frequent • Development of land should increase frequency • Methodology • Degree considered in models • Evaluate past event return period(s),if possible • No loss history – not necessarily no exposure Terrorism • Modeled by vendor model? Scope? • Adjustments needed • Take-up rate – current/future • Future of TRIA – exposure in 2007/8 • Other – depends on data
Unmodeled Perils Fire Following • No EQ coverage = No loss potential? NO!!!!! • Model reflective of FF exposure on EQ policies? • Severity adjustment of event needed, if • Some policies are EQ, some are FF only • Only EQ was modeled • Methodology • Degree considered in models • Compare to peer companies for FF only • Default Loadings for unmodeled FF • Multiplicative Loadings on EQ runs • Reflect difference in policy T&Cs
Unmodeled Perils Other Perils • Expected the unexpected • Examples: Blackout caused unexpected losses • Methodology • Blanket load • Exclusions, Named Perils in contract • Develop default loads/methodology for an complete list of perils
Summary Don’t trust the Black Box • Understand the weakness/strengths of model • Know which perils/losses were modeled • Perform reasonability checks • Add in loads to include ALL perils • Reflect the prospective exposure