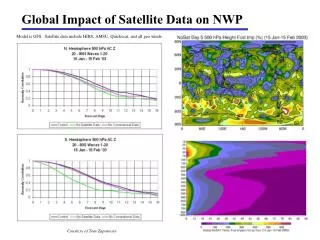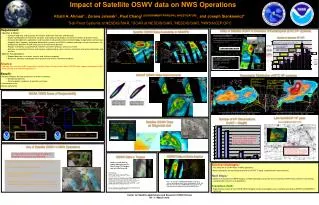
Impact of Enhanced Satellite Data Density in Critical Areas
120 likes | 218 Vues
This study delves into the ramifications of augmenting satellite data density in sensitive zones for weather forecasts. The research evaluates the trade-off between data impact and volume reduction, experiments with global and selective data thinning approaches, and analyzes the forecast impact at different data densities. The results indicate potential improvements in forecast accuracy with increased data density in specific areas. The findings suggest refining the current data thinning strategies to optimize forecast models in sensitive areas.

Impact of Enhanced Satellite Data Density in Critical Areas
E N D
Presentation Transcript
Impact of increased satellite data density in sensitive areas Carla Cardinali, Peter Bauer, Roberto Buizza, Jean-Noël Thépaut European Centre for Medium-Range Weather Forecasts in lovely Reading, Berkshire, UK 3rd THORPEX International Science Symposium 09/2009
Study contents • Background • Thinning of data is applied to: • reduce data volume • avoid the introduction of spatial observation error correlation that is currently not accounted for in data assimilation algorithm • Thinning is performed statically on a fixed latitude/longitude grid. • Objective • Evaluate impact of selective satellite observational data thinning on medium-range NWP aiming at denser data in sensitive areas and less dense data in other areas trade-off between data impact and data volume. • Approach • Experiments with global data thinning: • Change global latitude/longitude thinning grid. • Experiments with data thinning in selected regions: • Increased density in sensitive areas and reduced density elsewhere using a Singular Vector based measure to identify areas from which forecast errors are growing fast (ECMWF 2007 QJ papers). • Sensitive areas are computed for Southern Hemisphere 3rd THORPEX International Science Symposium 09/2009
Experiments • Global data thinning • Thinn_2.5 : global latitude/longitude thinning is 2.5o. • Thinn_1.25 : ~ is 1.25o current operational configuration • Thinn_0.625 : ~ is 0.625o. • Selective data thinning • Thinn_Cntrl : ~ is 1.25oproxy for Thinn_1.25 • Thinn_SV : ~ is 1.25o and 0.625o in SV areas. • Thinn_RD : ~ is 1.25o and 0.625o in randomly distributed areas. • Thinn_CSV : ~ is 1.25o and 0.625o in Climatological SV areas. • Thinn_0.625 • Additional information • All experiments are run at T511L91 (12-hour 4D-Var) for 01/12/2008-28/02/2009. • All experiments are verified with T799L91 operational model analyses (without first 7 days (spin-up) i.e. 83 cases). • All SV/RD/CSV areas occupy same fraction (15%) of the Southern hemisphere. • The SV-based climatology derived from the mean 2007 SV-areas. 3rd THORPEX International Science Symposium 09/2009
Global data thinning: Forecast impact Thin_2.5-Thin_1.2 500hPa Normalized RMSE 95% confidence 55 cases North H South H 0 1 2 3 4 5 6 7 8 Forecast Day 3rd THORPEX International Science Symposium 09/2009
0 1 2 3 4 5 6 7 8 Forecast Day Global data thinning: Forecast impact Thin_1.2-Thin_0.6 500hPa Normalized RMSE 95% confidence 83 cases North H South H 3rd THORPEX International Science Symposium 09/2009
Data coverage: Single case 01/01/2009 00 UTC data density AMSU-A channel 9: Singular Vectors: Randomly distributed circular areas: 2007 Singular Vector climatology: 3rd THORPEX International Science Symposium 09/2009
Data coverage: Average 01-07/01/2009 00 and 12 UTC data density AMSU-A channel 9: Singular Vectors: Randomly distributed circular areas: 2007 Singular Vector climatology: 3rd THORPEX International Science Symposium 09/2009
Selective data thinning: DFS Decrease of DFS relative to the Thin_0.625 experiment Global Southern Hemisphere 3rd THORPEX International Science Symposium 09/2009
Selective data thinning: Forecast impact SV-CNTRL Southern H. Normalized RMSE 95% confidence 83 cases 1000 hPa 500 hPa 200 hPa 0 1 2 3 4 5 6 7 8 Forecast Day 3rd THORPEX International Science Symposium 09/2009
Selective data thinning: Forecast impact SV-RD Southern H. Normalized RMSE 95% confidence 83 cases 1000 hPa 500 hPa 200 hPa 0 1 2 3 4 5 6 7 8 Forecast Day 3rd THORPEX International Science Symposium 09/2009
Selective data thinning: Forecast impact SV - CSV Southern H. Normalized RMSE 95% confidence 83 cases 1000 hPa 500 hPa 200 hPa 0 1 2 3 4 5 6 7 8 Forecast Day 3rd THORPEX International Science Symposium 09/2009
Conclusions • Global data thinning • Current operational setting (1.25o) is too conservative and satellite data density could be increased. • 0.625 º thinning will be considered for operational implementation. • Selective data thinning • Forecast scores are best for experiment with increased data density in SV-based areas that are updated for each analysis. • 40% loss of DFS by increasing the data density over SV areas instead than globally. • 0.42° thinning is thought to be used in SV areas. 3rd THORPEX International Science Symposium 09/2009