Download
1 / 15
150 likes | 313 Vues
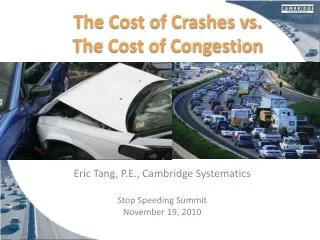
The Cost of Crashes vs. The Cost of Congestion. Eric Tang, P.E., Cambridge Systematics Stop Speeding Summit November 19, 2010. Cost of Congestion in the New York Metropolitan Area. $8.0 Billion (2007). Question.

E N D
The Cost of Crashes vs. The Cost of Congestion Eric Tang, P.E., Cambridge Systematics Stop Speeding Summit November 19, 2010
Cost of Congestion in the New York Metropolitan Area $8.0 Billion (2007)
Question... • Do you believe that the Cost of Congestion is greater than the Cost of Crashes?
Traffic Fatalities and Injuries in the New York Metropolitan Area • In 2007: • Over 1,000 fatalities in New York metro area • 273 in New York City proper • 200,000 injuries in New York metro area • Comparison: • 41,000 fatalities nationwide • 2.5 million injuries nationwide
FHWA Crash Costs Estimation • Comprehensive crash costs based on: • Medically-related costs • Emergency medical services • Property damage • Lost productivity • Monetized Quality-Adjusted Life Years (QALYs)
Value of Fatalities and Injuries • Based on FHWA guidance document on comprehensive cost of crashes
Cost of Crashes in the New York Metropolitan Area • $1 to $5 billion • $5 to $10 billion • $10 to $15 billion • $15 to $20 billion • Over $20 billion
Cost of Crashes in the New York Metropolitan Area $20.2 Billion (2007)
Unreported Crashes • Crash data is as good as the agencies charged with producing the data • Property Damage Only (PDO) crash numbers may not reflect the actual number of PDO crashes due to threshold reporting for the state
Comparison To Other Cities (2005 data) Examples CongestionCrashes L.A: $9.3 billion $10.6 billion New York: $7.4 billion $18.0 billion Chicago: $4.0 billion $8.4 billion Miami: $2.7 billion $7.8 billion D.C: $2.3 billion $5.1 billion 10
Comparison To Other Cities (2005 data) Examples CongestionCrashes Rochester: $64 million $1.0 billion Albany: $86 million $825 million Buffalo: $112 million $1.1 billion Hartford: $166 million $1.3 billion Bridgeport: $280 million $955 million New Haven: $104 million $1.1 billion 11
Ratio of Costs (2005 data) Ratio Crash Cost/Congestion Cost NYC: 2.44 Albany: 9.46 Buffalo: 9.74 Rochester: 15.85 12
Conclusions • The cost of crashes is 2.5 times more than the cost of congestion (2005 data) Congestion: $67.6 billion Crashes: $166.7 billion • You can develop your own Cost of Crashes analysis for any geographical area and educate the public • Speed not only kills – it also costs…
Thank You! • Eric Tang • Cambridge Systematics, Inc. • (510) 873-8700 • etang@camsys.com • Visit us at www.camsys.com • Engage with us on Twitter @ Camsys • Ask us questions @ http://facebook.com/Camsys