European Central Bank Balance Sheet Analysis and Monetary Policy Insights (September 2000)
This document provides a comprehensive overview of the European Central Bank (ECB) balance sheet as of September 2000, highlighting key data including monetary aggregates M0 and M2, money market multipliers, and seigniorage. It covers theoretical values of the money multiplier, outlines bank insurance practices, and analyzes monetary policy procedures like interest rate targeting versus money targeting. Key figures illustrate central bank assets, liabilities, and changes in reserves, offering insights into the ECB's operational framework amidst global monetary dynamics.

European Central Bank Balance Sheet Analysis and Monetary Policy Insights (September 2000)
E N D
Presentation Transcript
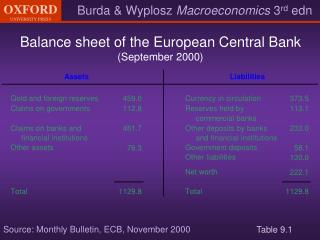
Balance sheet of the European Central Bank (September 2000) Source: Monthly Bulletin, ECB, November 2000 Table 9.1
M0, M2, money market multipliers and currency(2000) Table 9.2
Theoretical values of the money multiplier (M1/M0) Table 9.3
Seigniorage around the world Source: Masson, Savastano and Sahrma (1998) Table 9.4
Bank insurance Table 9.5
Monetary policy procedures Interest rate Interest rate Supply of base money (M0) Supply of base money (M0) (a) Money targeting (b) Interest rate targeting Figure 9.1
Central Bank Assets Liabilities Consolidated Governmentand Nonbank Private Sector Reserves of commercial banks Foreign assets Assets Liabilities Loans to comm. banks Government and private debt Bank notes held by nonbanks Bank notes held by nonbanks Claims on governments Deposits of private sector Deposits of government Where’sM0? Net worth Commercial Banks Assets Liabilities Vault cash and reserves at Central Bank Deposits of government Liabilities to Central Bank Deposits of private sector Real assets, incl. net worth of banking sector Loans and securities Net worth Figure 9.2 Net worth
Reserves change in reserves Deposits change in deposits Reserves-money stock link Figure 9.3
Currency Reserves Currency Deposits Reserves-money stock link with currency M0 change in reserves M1 change in deposits Figure 9.4
The money market B A C Interest rate 0 Figure 9.5 Monetary base (M0)
ECB interest rates EONIA = euro overnight index average Figure 9.6 1999 2000
Bank of England’s Fan (inflation forecasts as of November 2000) Percentage increase in prices on a year earlier Source: Inflation Report, Bank of England, November 2000 Figure 9.7
Foreign exchange market interventionand sterilization Figure 9.8
Reserve and capital adequacy ratios Figure 9.9