1 / 20

Oct 26, 2009

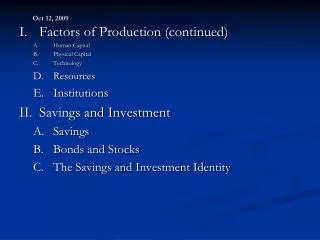
Oct 26, 2009. Unemployment Definition and Measurement Trends Causes Policies Cool graphic here: http:// www.mitacstrends.com/employment.html. Payroll Employment 1940-2009. How to Calculate Unemployment Rate. Yes. No. Yes. No. September 2009 Employment and Unemployment.

rupali
Télécharger la présentation

Oct 26, 2009

An Image/Link below is provided (as is) to download presentation Download Policy: Content on the Website is provided to you AS IS for your information and personal use and may not be sold / licensed / shared on other websites without getting consent from its author. Content is provided to you AS IS for your information and personal use only. Download presentation by click this link. While downloading, if for some reason you are not able to download a presentation, the publisher may have deleted the file from their server. During download, if you can't get a presentation, the file might be deleted by the publisher.

E N D

Presentation Transcript


  1. Oct 26, 2009 Unemployment Definition and Measurement Trends Causes Policies Cool graphic here: http://www.mitacstrends.com/employment.html

  2. Payroll Employment 1940-2009

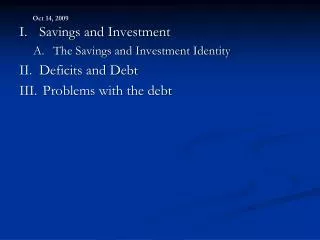
  3. How to Calculate Unemployment Rate Yes No Yes No

  4. September 2009 Employment and Unemployment Labor Force 154.0 million Employed People 138.9 million Unemployed People 15.1 million 15.1/(138.9+15.1)=15.1/(154) = 9.8% Source: http://www.bls.gov/news.release/empsit.nr0.htm

  5. Sept 09 Selected Unemployment Rates All 9.8% Adult Men 10.3% Adult Women 7.8% Black Male Teens 16-19 50.4% White Male Teens 16-10 26.6%

  6. Education, Unemployment, and Earnings

  7. Unemployment Rate 1948-2009

  8. Recent Unemployment Trends

  9. In a Recession, Unemployment is Longer

  10. Payroll Employment 1940-2009

  11. Participation Rate Rose 1965-2009

  12. Union Membership

More Related