Analog to Digital Converters Electronics Unit – Lecture 7
180 likes | 470 Vues
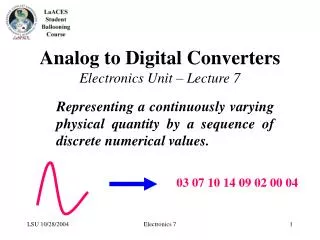
Analog to Digital Converters Electronics Unit – Lecture 7. Representing a continuously varying physical quantity by a sequence of discrete numerical values. 03 07 10 14 09 02 00 04. Conversion Methods (selected types, there are others). Ladder Comparison Successive Approximation

Analog to Digital Converters Electronics Unit – Lecture 7
E N D
Presentation Transcript
Analog to Digital ConvertersElectronics Unit – Lecture 7 Representing a continuously varying physical quantity by a sequence of discrete numerical values. 03 07 10 14 09 02 00 04 Electronics 7
Conversion Methods(selected types, there are others) Ladder Comparison Successive Approximation Slope Integration Flash Comparison Electronics 7
Ladder Comparison Electronics 7
- + Single slope integration • Charge a capacitor at constant current • Count clock ticks • Stop when the capacitor voltage matches the input • Cannot achieve high resolution • Capacitor and/or comparator Vin Counting time StartConversion StartConversion Enable S Q R N-bit Output Counter C IN Clk Oscillator Electronics 7
Successive Approximation Electronics 7
Flash Comparison If N is the number of bits in the output word…. Then 2N comparators will be required. With modern microelectronics this is quite possible, but will be expensive. Electronics 7
Pro and Cons Slope Integration & Ladder Approximation Cheap but Slow Electronics 7
Pro and Cons Flash Comparison Fast but Expensive Slope Integration & Ladder Approximation Cheap but Slow Electronics 7
Pro and Cons Successive Approximation The Happy Medium ?? Slope Integration & Ladder Approximation Cheap but Slow Flash Comparison Fast but Expensive Electronics 7
Resolution Suppose a binary number with N bits is to represent an analog value ranging from 0 to A There are 2N possible numbers Resolution = A / 2N Electronics 7
Resolution Example Temperature range of 0 K to 300 K to be linearly converted to a voltage signal of 0 to 2.5 V, then digitized with an 8-bit A/D converter 2.5 / 28 = 0.0098 V, or about 10 mV per step 300 K / 28 = 1.2 K per step Electronics 7
Resolution Example Temperature range of 0 K to 300 K to be linearly converted to a voltage signal of 0 to 2.5 V, then digitized with a 10-bit A/D converter 2.5 / 210 = 0.00244V, or about 2.4 mV per step 300 K / 210 = 0.29 K per step Is the noise present in the system well below 2.4 mV ? Electronics 7
Quantization Noise Each conversion has an average uncertainty of one-half of the step size ½(A / 2N) This quantization error places an upper limit on the signal to noise ratio that can be realized. Maximum (ideal) SNR ≈ 6 N + 1.8 decibels(N = # bits) e.g. 8 bit → 49.8 db, 10 bit → 61.8 db Electronics 7
Signal to Noise RatioRecovering a signal masked by noise Some audio examples In each successive example the noise power is reduced by a factor of two (3 db reduction), thus increasing the signal to noise ratio by 3 db each time. Example 1 Example 2 Example 3 Example 4 Electronics 7
Conversion Time Time required to acquire a sample of the analog signal and determine the numerical representation. Sets the upper limit on the sampling frequency. For the A/D on the BalloonSat board, TC ≈ 32 μs, So the sampling rate cannot exceed about 30,000 samples per second (neglecting program overhead) Electronics 7
Data Collection – Sampling Rate The Nyquist Rate Asignal must be sampled at a rate at least twice that of the highest frequency component that must be reproduced. Example – Hi-Fi sound (20-20,000 Hz) is generally sampled at about 44 kHz. External temperature during flight need only be sampled every few seconds at most. Electronics 7
Activity E7a Do the HuSAC® a party game for techies... Human Successive Approximation Converter Electronics 7
Activity E7b Data Acquisition Using BalloonSat Electronics 7